Bullstory Research July 16, 2026
If you read just one article before the market opens on Monday, this is the one for SK Hynix.
Key takeaways
Monday’s open reflects the combined impact of two trading days in the U.S. market, and SK Hynix’s key watershed is the gap direction at the open and 168.2holding the ten-thousand-won area. An initial lower wick can create a rebound, but if supply from breakeven holders comes in during a retest of support, the likelihood of further downside is high, so set your entry and stop-loss rules clearly in advance.
Tomorrow, the domestic market will be closed.
This also means that the two days of U.S. market movement leading into Monday's open will be reflected all at once in the meaning of this
Therefore, the candle that will form on Monday can only have a very different weight from an ordinary candle.
So I would like to summarize the situation in advance for the weekend.
First, let's review what kind of movement we saw today.
Today, there was a sharp drop of -12%.
The low was 1,821,000won, and the close also finished precariously near the low.
On the numbers alone, it may look like a sudden crash, but if you have been steadily following the chart's movement, you will know.
It was by no means a drop that happened all of a sudden.
In the previous move, when it seemed to break through the diagonal trend line but failed to establish itself and was pushed back down again, I had already said that the probability of that move being a 'false breakout' was high.
It was a clear signal that the selling pressure pushing downward was much stronger than the buying pressure trying to move upward, and in the end that accumulated downward pressure
was unleashed all at once today.
In other words, this was the natural course of the chart, not a sudden accident.
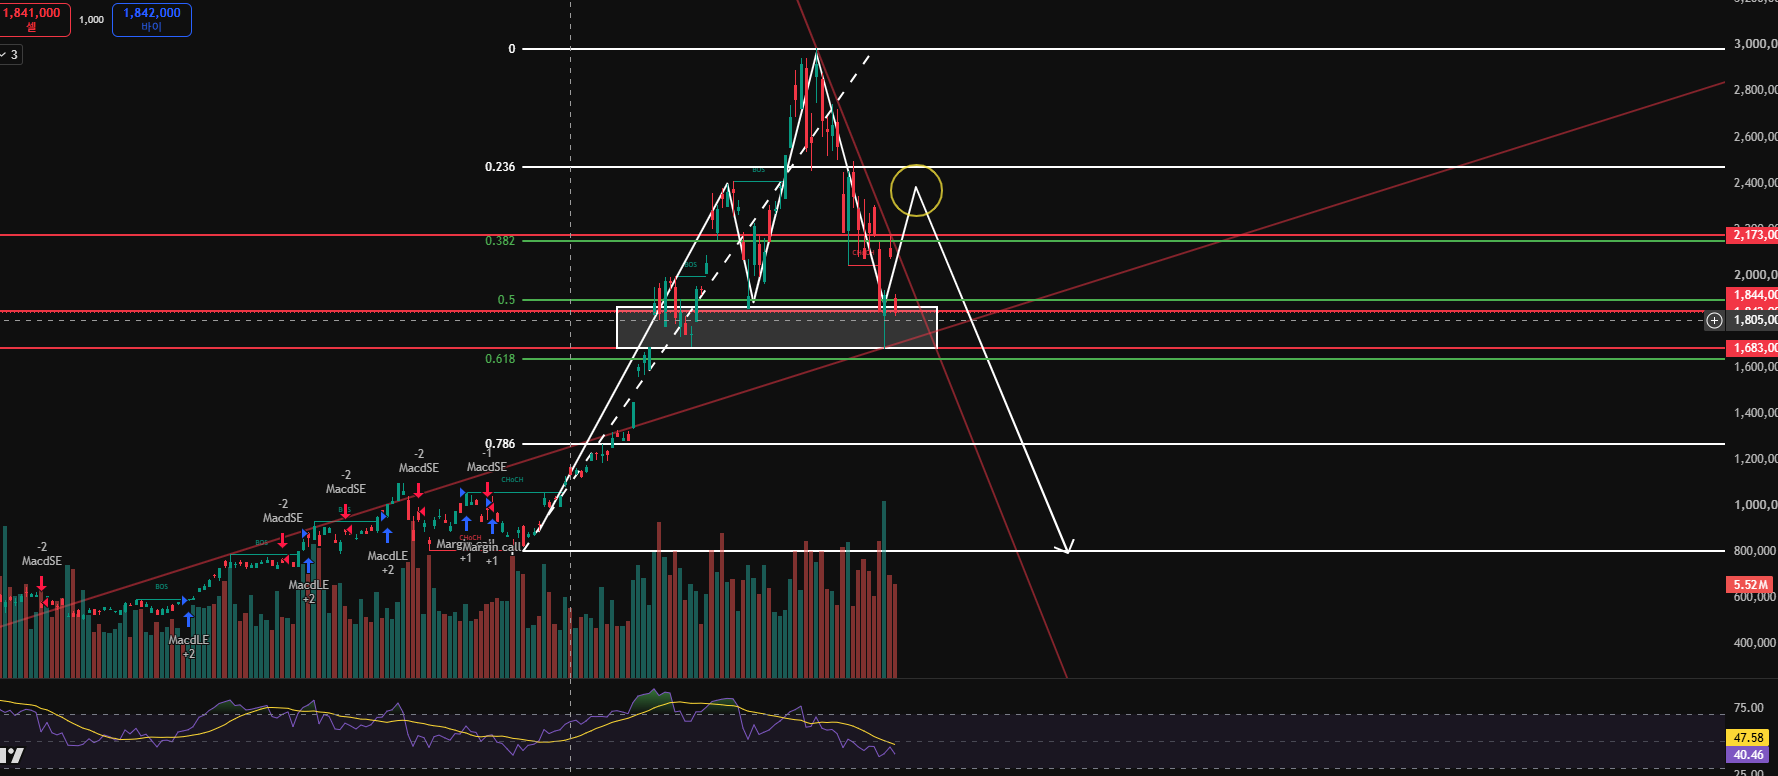
Then how far has the stock price actually fallen? Many people look only at one specific level, '168 won,' but
more precisely, this should be seen not as a line but as a 'zone'.
The long-term trend line coming down from above and the lower edge of the cloud band on the Ichimoku Kinko Hyo overlap around 172 won, and if we apply Fibonacci retracement to the entire upward wave so far, the 0.618 range is pinned exactly at 168.2 won.
In conclusion, the area from 168 won to 175 won has become the final defensive zone that must absorb the decline as a whole.
The lower wick on today's daily candle is not just an ordinary wick either.
It is evidence that the price touched the very beginning of the defensive zone I just mentioned and bounced back up.
It means that someone -12% strong selling pressure had absorbed supply at that level.
The 'first response' to the decline has definitely appeared.
However, you should not mistake the first defense seen here for a “real defense” that has established a perfect bottom. The first touch when a support zone is reached is, in principle, technically bound to bounce. When a level where several support lines overlap is touched for the first time, mechanically entering buy orders, short covering, and bargain-hunting buy orders after an excessive drop all pile in at once, so it would actually be strange if there were no rebound. The issue is that this is the third test. When price comes back down to test the support line again, most of the rebound buying power that had come in before has already been exhausted, so the probability of breaking down to the downside is much higher than on the first touch.
Current technical indicators are also not yet telling us that this is a perfect bottom. RSI is 40 around the area, so there is still room for it to fall further into the oversold zone, and above all, today’s decline is accompanied by strong volume1 This means that someone deliberately threw down a large amount of stock in a rough way and dragged the share price lower. Also, the thickness of the MACD histogram is still increasing. A true bottom often appears when this histogram starts to shrink and forms divergence. All three indicators are still speaking with one voice: be wary of making an early judgment. Therefore, even if a low is made next Monday, the technical textbook picture is much closer to consolidating firmly at the low for several days rather than bouncing sharply in a V-shape all at once.0
When it first reaches the support area, the initial touch is, by nature, technically likely to bounce.
If several support lines overlap, mechanically flowing-in buy orders, short covering, and bargain-hunting buy orders after an excessive drop all pile in at once, so it would actually be strange if there were no rebound.
The issue is that this is the third test.
When price comes back down to test the support line again, most of the rebound buying power that came in earlier has already been exhausted,
so the probability of breaking down to the downside is much higher than on the first touch.9
Current technical indicators are also not yet telling us that this is a perfect bottom.
RSI is 98 around the area, so there is still room for it to fall further into the oversold zone, and
above all, today’s decline is accompanied by strong volume9
This means that someone deliberately threw down a large amount of stock in a rough way and dragged the share price lower.
Also, the thickness of the MACD histogram is still increasing.
A true bottom often appears when this histogram starts to shrink and forms divergence.
All three indicators are still speaking with one voice: be wary of making an early judgment.
Therefore, even if a low is made next Monday, the technical textbook picture is much closer to consolidating firmly at the low for several days
rather than bouncing sharply in a V-shape all at once.89
This means that someone deliberately threw down a large amount of stock in a rough way and dragged the share price lower.
Also, the thickness of the MACD histogram is still increasing.
A true bottom often appears when this histogram starts to shrink and forms divergence.
All three indicators are still speaking with one voice: be wary of making an early judgment.
Therefore, even if a low is made next Monday, the technical textbook picture is much closer to consolidating firmly at the low for several days
rather than bouncing sharply in a V-shape all at once.3Monday’s movement can be broadly divided into two paths.4The first: if the market opens by rebounding.
The target price would be roughly between 8 million won and 94 million won, from the upper supply zone to the diagonal trendline.
But to be honest, I think this scenario is much more dangerous.
That range is also the psychological “break-even line” for investors who got trapped at the highs over the past 2 weeks.
It is a place where layers of sell orders waiting in the wings are stacked up, saying they will sell as soon as they can get back to break-even.
The rebound on the 95th is likely to run into that wall and get blocked right away, and if the daily close does not firmly settle above the diagonal line, it will ultimately confirm a “downward wave with lower highs.”
If it then pours back into the 99 million won range, that is the “truly dangerous second test” I mentioned earlier.
At a true bottom, people cannot buy because of fear, then feel relieved when they see the price recover into the 84 million won area and buy late by following along.
But you must remember that a sell-side bomb is waiting exactly there.
In the market, the dominant force always sells individual investors’ hopes at the highest possible price.00The second: if the market opens with a gap down.
In this scenario, it will be a fierce battle over whether the 95 million won line can be defended.
What you should watch closely here are exactly two things: volume and the lower wick.
If volume surges and the daily candle leaves a long lower wick while closing above 3 million won, this can instead be interpreted as a positive bottom signal.
That is because it is a classic shaking-out pattern in which institutions absorb all the panic selling and stop-loss orders from individuals and then lift the price back up.
On the other hand, if the candle closes below 5 million won and fails to recover back above it even by the next day, the situation becomes very serious. Below that level there is a gap in the supply zone, so you must pay special attention to the fact that there is no clear support line to defend the decline down to the 3 million won area.8The second: if the market opens with a gap down. In this scenario, it will be a fierce battle over whether the 9 million won line can be defended. What you should watch closely here are exactly two things: volume and the lower wick. If volume surges and the daily candle leaves a long lower wick while closing above 94 million won, this can instead be interpreted as a positive bottom signal. That is because it is a classic shaking-out pattern in which institutions absorb all the panic selling and stop-loss orders from individuals and then lift the price back up.
On the other hand, if the candle closes below 9 million won and fails to recover back above it even by the next day, the situation becomes very serious. Below that level there is a gap in the supply zone, so you must pay special attention to the fact that there is no clear support line to defend the decline down to the 8 million won area.0The second: if the market opens with a gap down. In this scenario, it will be a fierce battle over whether the 8 million won line can be defended. What you should watch closely here are exactly two things: volume and the lower wick. If volume surges and the daily candle leaves a long lower wick while closing above 8 million won, this can instead be interpreted as a positive bottom signal. That is because it is a classic shaking-out pattern in which institutions absorb all the panic selling and stop-loss orders from individuals and then lift the price back up.
On the other hand, if the candle closes below 8 million won and fails to recover back above it even by the next day, the situation becomes very serious. Below that level there is a gap in the supply zone, so you must pay special attention to the fact that there is no clear support line to defend the decline down to the 97 million won area.90The second: if the market opens with a gap down. In this scenario, it will be a fierce battle over whether the 84 million won line can be defended. What you should watch closely here are exactly two things: volume and the lower wick. If volume surges and the daily candle leaves a long lower wick while closing above 9 million won, this can instead be interpreted as a positive bottom signal. That is because it is a classic shaking-out pattern in which institutions absorb all the panic selling and stop-loss orders from individuals and then lift the price back up.
On the other hand, if the candle closes below 7 million won and fails to recover back above it even by the next day, the situation becomes very serious. Below that level there is a gap in the supply zone, so you must pay special attention to the fact that there is no clear support line to defend the decline down to the 84 million won area.7The second: if the market opens with a gap down. In this scenario, it will be a fierce battle over whether the 9 million won line can be defended. What you should watch closely here are exactly two things: volume and the lower wick. If volume surges and the daily candle leaves a long lower wick while closing above 8 million won, this can instead be interpreted as a positive bottom signal. That is because it is a classic shaking-out pattern in which institutions absorb all the panic selling and stop-loss orders from individuals and then lift the price back up.
On the other hand, if the candle closes below 0 million won and fails to recover back above it even by the next day, the situation becomes very serious. Below that level there is a gap in the supply zone, so you must pay special attention to the fact that there is no clear support line to defend the decline down to the 98 million won area.8The second: if the market opens with a gap down. In this scenario, it will be a fierce battle over whether the 0 million won line can be defended. What you should watch closely here are exactly two things: volume and the lower wick. If volume surges and the daily candle leaves a long lower wick while closing above 80 million won, this can instead be interpreted as a positive bottom signal. That is because it is a classic shaking-out pattern in which institutions absorb all the panic selling and stop-loss orders from individuals and then lift the price back up.
On the other hand, if the candle closes below 0 million won and fails to recover back above it even by the next day, the situation becomes very serious. Below that level there is a gap in the supply zone, so you must pay special attention to the fact that there is no clear support line to defend the decline down to the 4 million won area.82The second: if the market opens with a gap down. In this scenario, it will be a fierce battle over whether the 4 million won line can be defended. What you should watch closely here are exactly two things: volume and the lower wick. If volume surges and the daily candle leaves a long lower wick while closing above 8 million won, this can instead be interpreted as a positive bottom signal. That is because it is a classic shaking-out pattern in which institutions absorb all the panic selling and stop-loss orders from individuals and then lift the price back up.
On the other hand, if the candle closes below 94 million won and fails to recover back above it even by the next day, the situation becomes very serious. Below that level there is a gap in the supply zone, so you must pay special attention to the fact that there is no clear support line to defend the decline down to the 2 million won area.95.
If volume surges and the daily candle leaves a long lower wick while closing above
Monday’s movement can be broadly divided into two paths.
The first: if the market opens by rebounding. The target price would be roughly between 195 million won and 208 million won, from the upper supply zone to the diagonal trendline. But to be honest, I think this scenario is much more dangerous. That range is also the psychological “break-even line” for investors who got trapped at the highs over the past 2 weeks. It is a place where layers of sell orders waiting in the wings are stacked up, saying they will sell as soon as they can get back to break-even. The rebound on the 1th is likely to run into that wall and get blocked right away, and if the daily close does not firmly settle above the diagonal line, it will ultimately confirm a “downward wave with lower highs.” If it then pours back into the 168 million won range, that is the “truly dangerous second test” I mentioned earlier. At a true bottom, people cannot buy because of fear, then feel relieved when they see the price recover into the 190 million won area and buy late by following along. But you must remember that a sell-side bomb is waiting exactly there. In the market, the dominant force always sells individual investors’ hopes at the highest possible price.
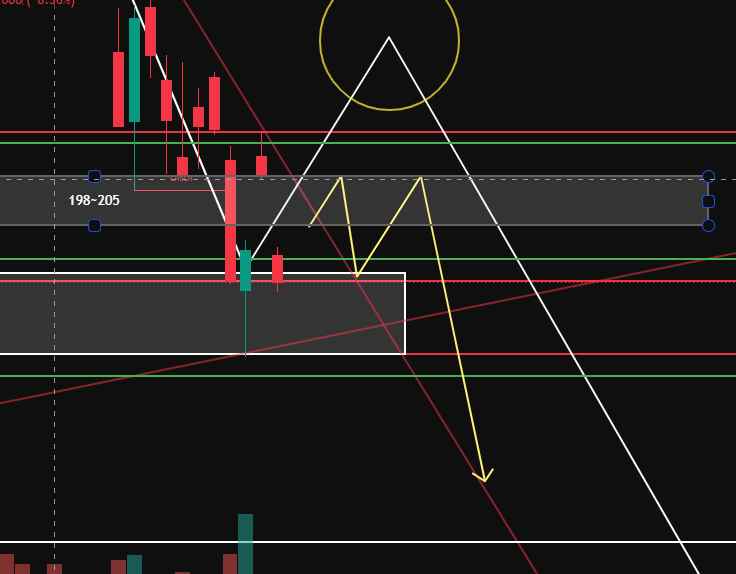
The second: if the market opens with a gap down. In this scenario, it will be a fierce battle over whether the 168.2 million won line can be defended. What you should watch closely here are exactly two things: volume and the lower wick. If volume surges and the daily candle leaves a long lower wick while closing above 85 million won, this can instead be interpreted as a positive bottom signal. That is because it is a classic shaking-out pattern in which institutions absorb all the panic selling and stop-loss orders from individuals and then lift the price back up.
On the other hand, if the candle closes below 20 million won and fails to recover back above it even by the next day, the situation becomes very serious. Below that level there is a gap in the supply zone, so you must pay special attention to the fact that there is no clear support line to defend the decline down to the 70 million won area.168The second: if the market opens with a gap down. In this scenario, it will be a fierce battle over whether the 168.2 million won line can be defended. What you should watch closely here are exactly two things: volume and the lower wick. If volume surges and the daily candle leaves a long lower wick while closing above 150 million won, this can instead be interpreted as a positive bottom signal. That is because it is a classic shaking-out pattern in which institutions absorb all the panic selling and stop-loss orders from individuals and then lift the price back up.
On the other hand, if the candle closes below
Lastly, let me summarize. The key points we need to check in the upcoming Monday session are the following three.
-The direction of the opening gap (whether it starts higher or starts lower)
-168.2Whether the ten-thousand-won range holds
-If a rebound appears, whether the daily close is made above the diagonal line
Right now, this is by no means a place to blindly guess or predict whether the stock price will rise or fall. This is a range where we must first confirm which side the conditions shown by the market are completed on, and then respond accordingly.
Frequently asked questions
What is the first point to check before SK Hynix opens on Monday?
The key is the direction of the opening gap, 168.2whether the ten-thousand-won area can be held, and whether the daily candle closes above the angled line (trend line). These three factors determine the next move.
How should one respond if the opening price starts with a gap-up?
After a gap-up, 195 million to 208 million supply zone there is a high chance of supply coming out. If the daily candle does not clearly settle above the diagonal line, avoid chasing the buy.
If the opening price starts with a gap-down and 168.2tests the million-won level, what should one look at?
If trading volume surges sharply, forming a long lower wick, and 168.2closes above the million-won level, that is a positive signal. Conversely, if it closes below that level, you should keep in mind the possibility of further downside.
168.2If the million-won range breaks, how far is open?
168.2If the million-won level gives way, there may be no clear support, 150 and a downside gap could open to the million-won range. If the defense zone is lost, consider cutting losses and reducing position size.
Why is it important for the daily candlestick to close above the diagonal line?
A daily candlestick settling within the diagonal line is a signal that distinguishes whether the prior high is being recovered and whether supply is being absorbed. It must close stably above it for the probability of the rebound continuing to increase.