Bullstory Research June 9, 2026
People who go in without knowing this week's indicators and end up blowing up their portfolios will appear.
Key takeaways
In the market, 5the probability that the monthly CPI will 4.2exceed 60is seen at 6before the FOMC in 17released and, if it pushes up the median dot plot, the chance of rate cuts this year could disappear. It can ripple at the same time through stocks, bonds, the dollar, and the won, so be sure to check core CPI and the median dot plot.
Someone who goes in without knowing this week's indicators will end up wrecking their portfolio.
To be honest.
There will be investors who simply get through this week. “The rate isn’t going to change anyway” 라 they’ll think. They will only realize that thinking was wrong, 6month 17day, after the market opens.
This week’s CPI is not just a simple inflation statistic. It is the last data released just before the FOMC meeting where the Fed decides interest rates. Depending on how this number comes out, the Fed members’ dot plot will change, and if the dot plot changes, stocks, bonds, the dollar, and the won will all move at the same time.
After reading this article, you will have three things.
① what to look at first when the numbers come out ② which numbers will show where the market is headed **③ 6what really matters in the monthly FOMC
If you do not focus, you may get flustered by the numbers and make the wrong judgment, or simply miss a good entry point.
This week’s schedule — remember only this

The dot plot appears only 1 times a year. 4·3·6·9·12 month. This 6 month is that timing. The dot plot moves the market more than the interest-rate decision.
4Monthly CPI: what was the problem?
The problem was not that the number rose. The problem was why it rose.
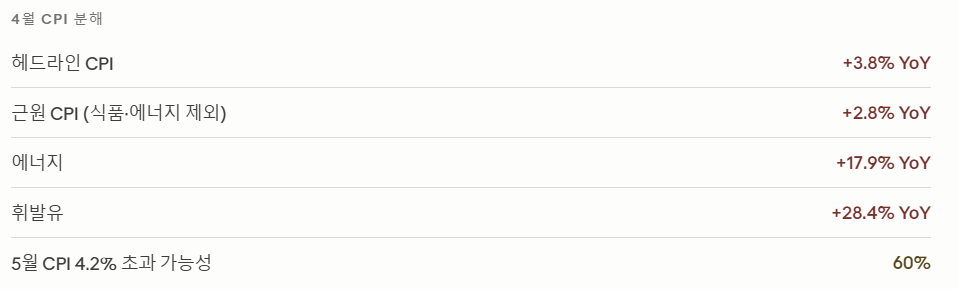
The energy shock was due to the Iran war. That is understandable. The problem is that core CPI rose to %. This number, which includes rent, medical care, and services, rising means price pressures have begun to spread from energy to the broader economy.2.8.**
The oil-price shock may be one-time. A rising core is different.
5Monthly CPI market estimate: 4.2% possibility of exceeding 60%
Consumer inflation expectations at the University of Michigan are already 4.8%.
Why look at PPI the next day — it’s easy to understand if you look at the structure
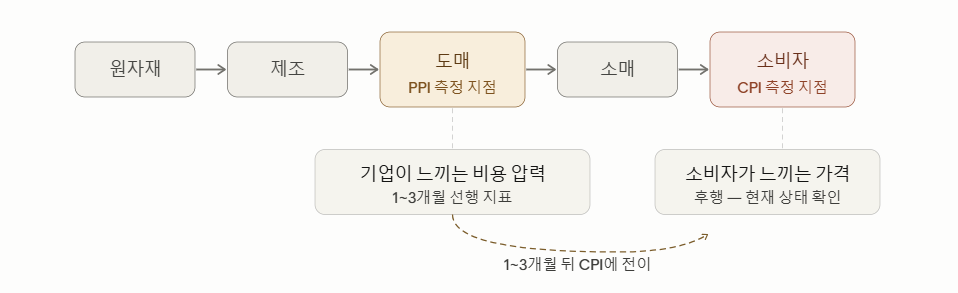
If PPI is high, it passes through to CPI one to three months later. It is a leading signal.
4How about monthly PPI.

Cost pressures are already building significantly at the corporate level. The key issue is whether that is now passing through to consumers.
CPI = how expensive things are right now / PPI = whether there is still material left that could push prices higher
Looking at the two together lets you judge whether inflation is easing or building again.
Why is the FOMC important if rates are not changing?
The market sees a 6 probability of a rate hold at the FOMC in 99.3 The current benchmark rate is 3.50 to 3.75%. Then why is this meeting important?
The answer is the dot plot.
The dot plot is a chart in which 19 Federal Reserve members each mark a dot to show the level they think rates should be at going forward.
3This was the dot plot distribution in
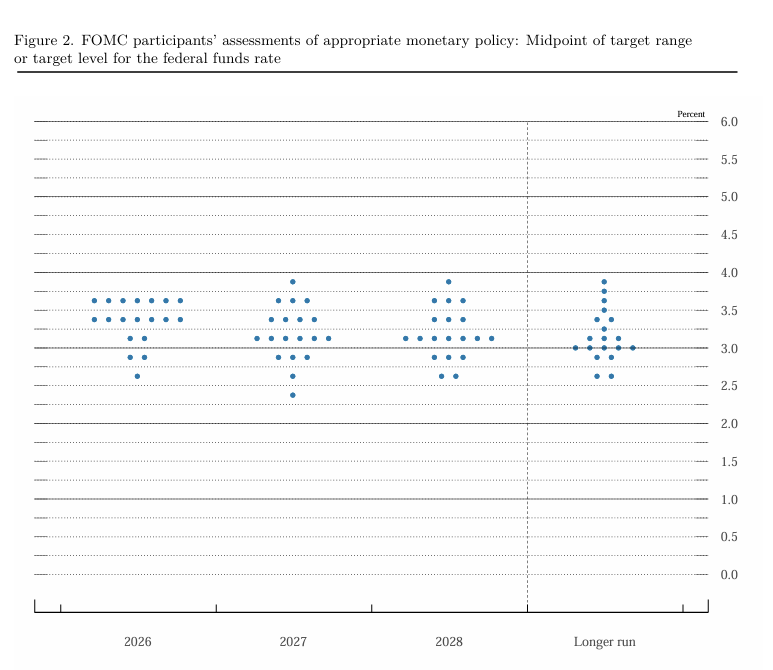
Right now it is split half and half between "freeze 7 names vs 1 rate cuts 7 names." If the median shifts up by just one notch, it changes to "no rate cuts this year." At that moment, the market’s overall rate expectations flip.
It all depends on this week’s CPI.
If the median of the dot plot moves up → short-term Treasury bonds → the dollar → gold → stocks → credit-sensitive sectors are affected in sequence
What is happening inside the Fed
4On the 29th, at Powell’s final FOMC meeting, dissenting votes came in at 4. For the first time since 1992.
But this is not just a minority opinion. The direction has split into two paths.
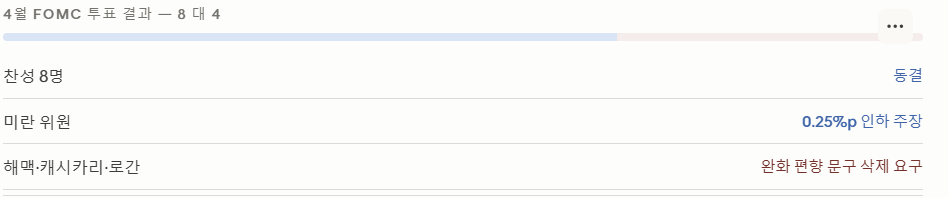
Even New York Fed President Williams has said that “the phrase suggesting a cut should be removed.” The trend is shifting from a minority to a majority.
6At the monthly meeting, these three may this time call not for “removal of the easing bias” but for “adding a tightening bias.”
If this week’s CPI comes in high, their argument gains more traction. Even if it comes in low, as long as geopolitical uncertainty does not disappear, the likelihood that their stance will change is low.
6The monthly FOMC meeting is one in which a single line in the statement, or one dissenting vote, can move the market more than the rate decision.
This Week’s Practical Checklist — For Korean Investors
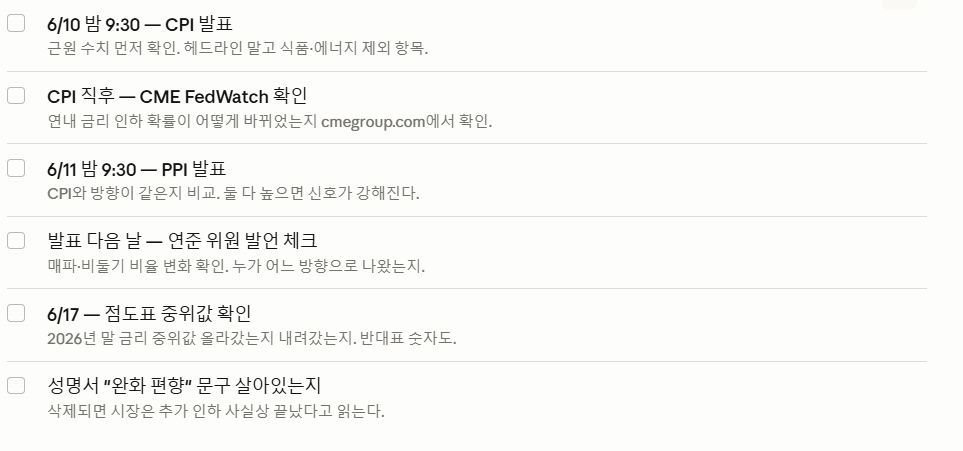
Just one core CPI line, one median dot plot number. If you read just those two properly, you can get through half of this week already.
6Day 10. By then, you already know where the market is likely to jump.
This report is not investment advice. All investment decisions are your own responsibility. *© Bullstory Report — ***bullstory.co.kr
Frequently asked questions
Before this week's U.S. Consumer Price Index (CPI) release, should I reduce the stocks I hold?
There is no need to sell everything. Review the reaction to core CPI and the dot plot, then adjust your allocation by checking credit-sensitive sectors first.
If stronger-than-expected inflation data comes out, which should be reduced first: bonds, the dollar, or stocks?
When inflation is strong, expectations for short-term rates rise, so short-term Treasuries and the dollar move first. Reduce credit-sensitive stock exposure first.
What do core CPI and PPI mean, respectively?
Core CPI is current inflation pressure, including rent, medical care, and services. PPI is a cost measure at the corporate stage and a leading indicator showing whether it will pass through to consumer prices later.
What is the median dot plot, and why does it matter?
The median dot plot is the median of Federal Reserve officials’ interest-rate projections. Even a one-step increase can change market rate expectations and have a major ripple effect on stocks, bonds, and the dollar.
Why is PPI announced the day after CPI?
PPI is an indicator that captures changes in corporate costs first, so it leads CPI. Reporting them back to back makes the inflation trend easier to see.