Bullstory Research September 3, 2026
JEPI dividend yield 8%, real or illusion. 2026Things to check before investing
Key takeaways
JEPI's forward dividend yield is 8.27%. This dividend comes from equity-linked notes (ELNs) and option premiums, and the ex-dividend date is 2026year 7month 1day. The payout amount changes every month, so you should check the monthly details before investing.
What is JEPI’s dividend yield right now
2026As of 7month, the dividend yield of JEPI (JPMorgan Equity Premium Income ETF) is in the low 8% range.
Forward dividend yield(the figure obtained by dividing the dividends expected to be received going forward by the current share price) is 9%. 8The monthly payment is 93dollars per share.9.0The monthly payout is 0per share.8.9The forward dividend yield is 88.98The monthly distribution amount is 9.5This figure reflects the dividends expected to be received in the future divided by the current stock price.5 It is 0.8.27The amount paid each month is 7.0.39per share.
Ex-dividend date is 0year 8month 9day, and the actual deposit date is 9year 9month 2026day.7The ex-dividend date is 1.2026The actual deposit date is 7.6.
After reading this article, you can see at a glance the conditions under which this number appears and how much actually goes into your investment capital.

How much comes in per share
On an annualized basis, it is about 4.59 dollars per share.
12If divided over 0.38 months, about 0.39 dollars is paid out each month.
The share price is in the mid-56dollar range, so 100 worth is an intuitive way to think about it.
For example, suppose you invest 1 dollars (about 1,370 won).
At the current share price of 56.75 dollars, you could buy about 176 shares.
Before tax, it comes to about 806 dollars a year, or about 67 dollars a month.
One important point is that the monthly amount is not fixed.
JPMorgan discloses the amount to be paid for the month about a week before each ex-dividend date.
The amount varies depending on that month’s options premium income, and usually ranges from 0.35 dollars per share to 0.50 dollars per share.
It is not structured like bank interest, where the same amount is deposited every month.
2026Dividend schedule remaining for 2026years
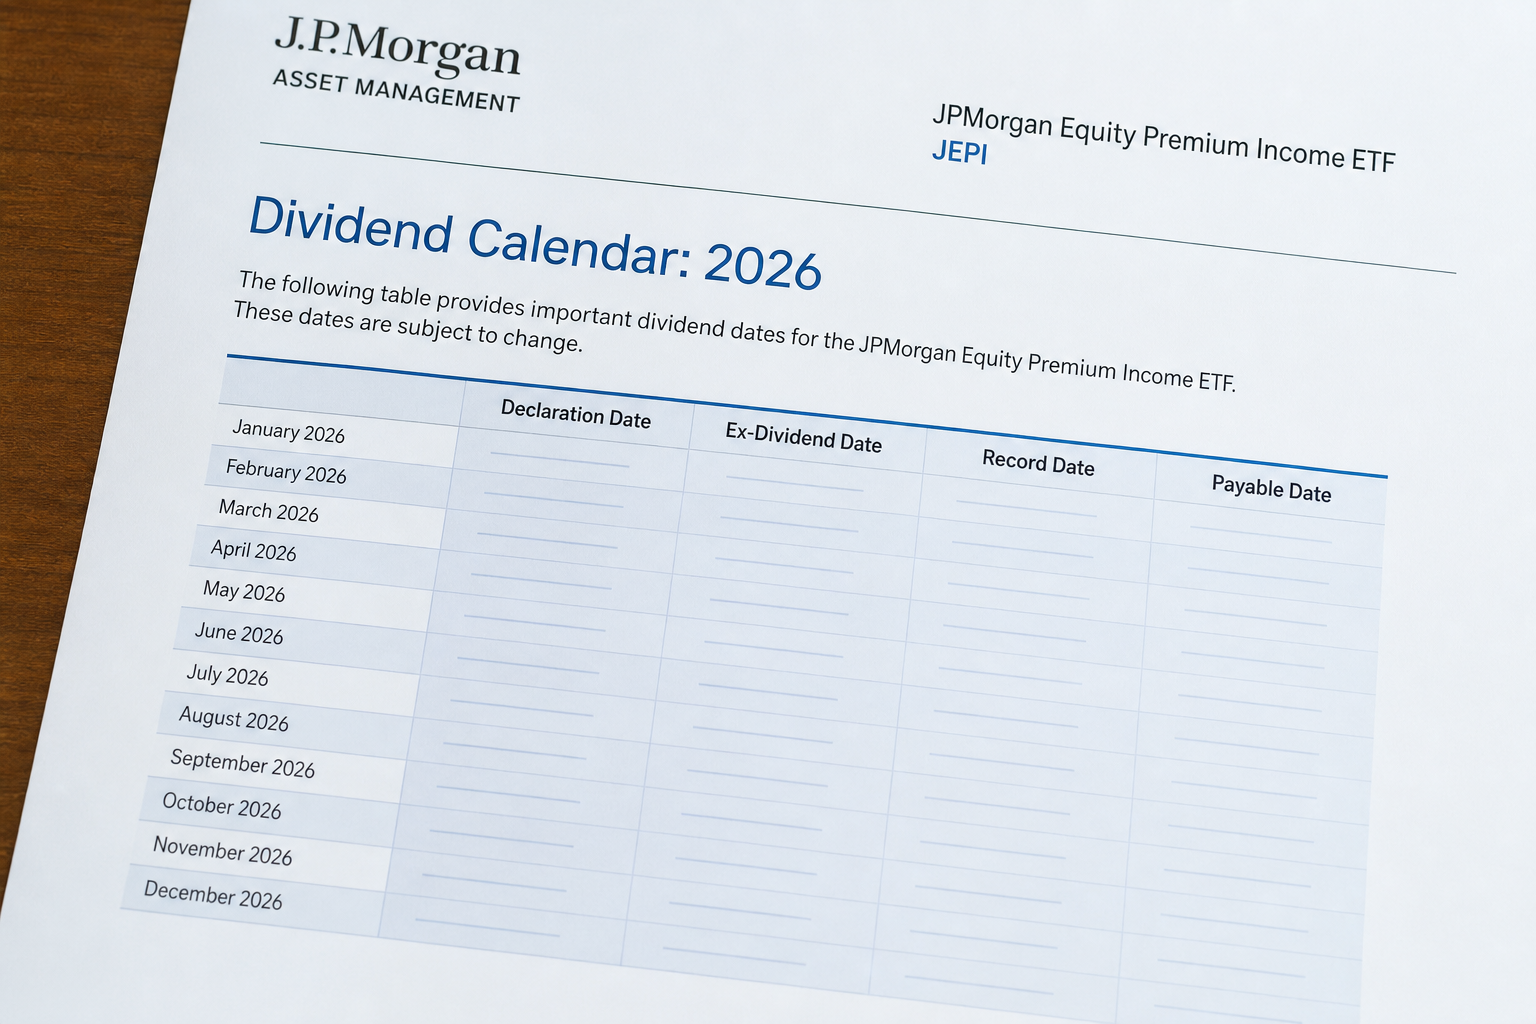
Summarizing the dividend calendar disclosed by J.P. Morgan (based on official materials distributed by J.P. Morgan Asset Management), it is as follows.
| Month | Ex-date (buy before this day) | Actual deposit date |
|---|---|---|
| 8month | 2026year 8month 3day | |
| 2026year 8month 5day | ||
| 9month | 2026year 9month 1day | |
| 2026year 9month 3day | ||
| 10month | 2026year 10month 1day | |
| 2026year 10month 5day | ||
| 11month | 2026year 11month 2day | |
| 2026year 11month 4day | 12month | 2026year 12month 1day |
If you buy on the morning of the ex-date itself, it is already too late.
More precisely, you must complete the purchase before the market close one day before the ex-date to receive that month’s dividend.
Because settlement for U.S. stocks takes 1 business days.
Scale of operations and fees
The total assets under management (AUM, the sum of the money that has flowed into this fund) are 446hundred million dollars (about 61trillion won).](/blog/news-8979ee5cffd38872-mqe1ofqk-0)
Just by size alone, it is a large product that ranks among the biggest in the U.S. ETF market.
The annual management fee is 0.35%.
For example, if you entrust 1dollars, the fee amounts to 1a year and 35dollars.
Among monthly-dividend covered call ETFs (a strategy that sells call options on stocks held in the portfolio), it is not on the low side, but it is not an excessive level compared with competing products.
8% dividend yield still does not tell you even half of where this number comes from.
The following explains why the source of this money is fundamentally different from that of a plain dividend ETF.
Where this money comes from
The fact that JEPI’s dividend yield stays in the 8% range is a number that would be impossible from stock dividends alone.
The return comes from two channels.
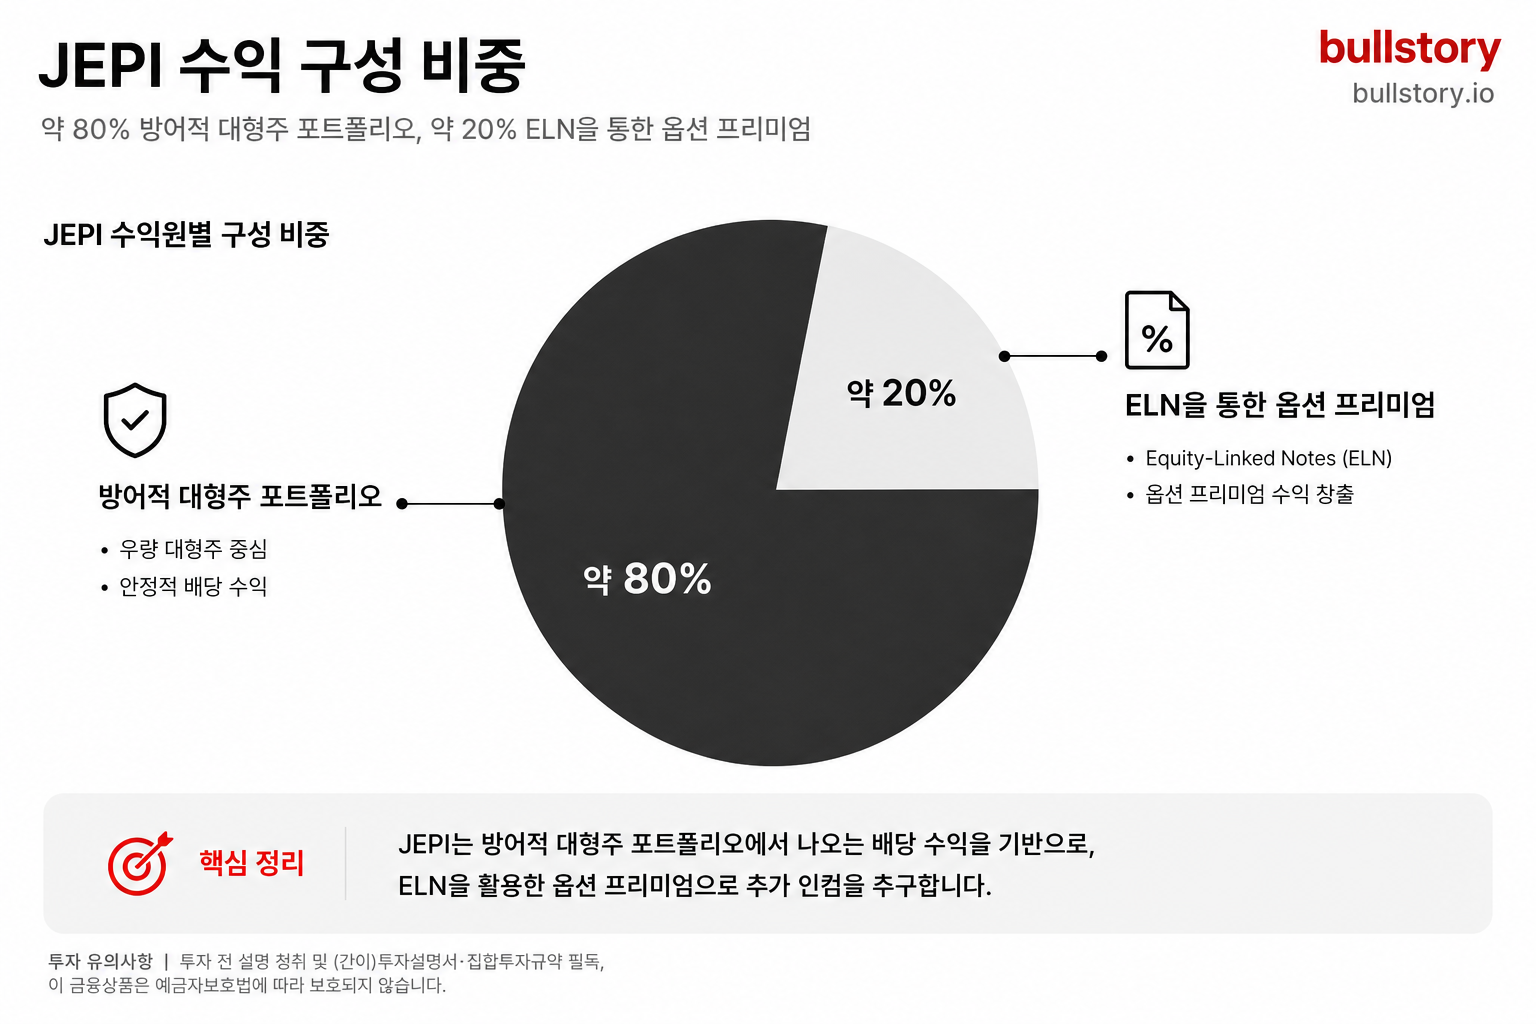
About 80% of total assets is invested in a defensive U.S. large-cap equity portfolio. The rest (the regulatory cap is 20%, and the current actual allocation is about 15%) is put into ELNs (Equity-Linked Notes) to sell S&P 500 call options. Those call-option premiums become the source material for the monthly distributions.
This means that the current dividend yield is produced only when the two sources are combined.
What is a covered call?
A covered call is a strategy in which you hold a stock and sell a call option on that stock. The counterparty that buys the call option pays a premium, and that premium is distributed to ETF investors as a payout.
To put it another way, it is like owning my apartment while selling someone the “right to buy it at a price slightly above market within3 months” and receiving a deposit. If the apartment price stays below that level, the deposit is simply mine. If the apartment price surges, I have to give up the upside.
The trade-off is clear. In exchange for receiving cash income right away, you give up that excess return when the market rises strongly. When the market moves sideways or falls, option premiums act as a buffer that traditional stock ETFs do not have.
Why JEPI is different from a typical covered-call ETF
JEPI is a little unusual here.
JEPI directly selects and holds defensive stocks from the S&P 500 constituents, while selling call options with 500-month expirations on the entire S&P 1 index. It sets the strike price slightly above the current price, leaving some room for the index to rise.
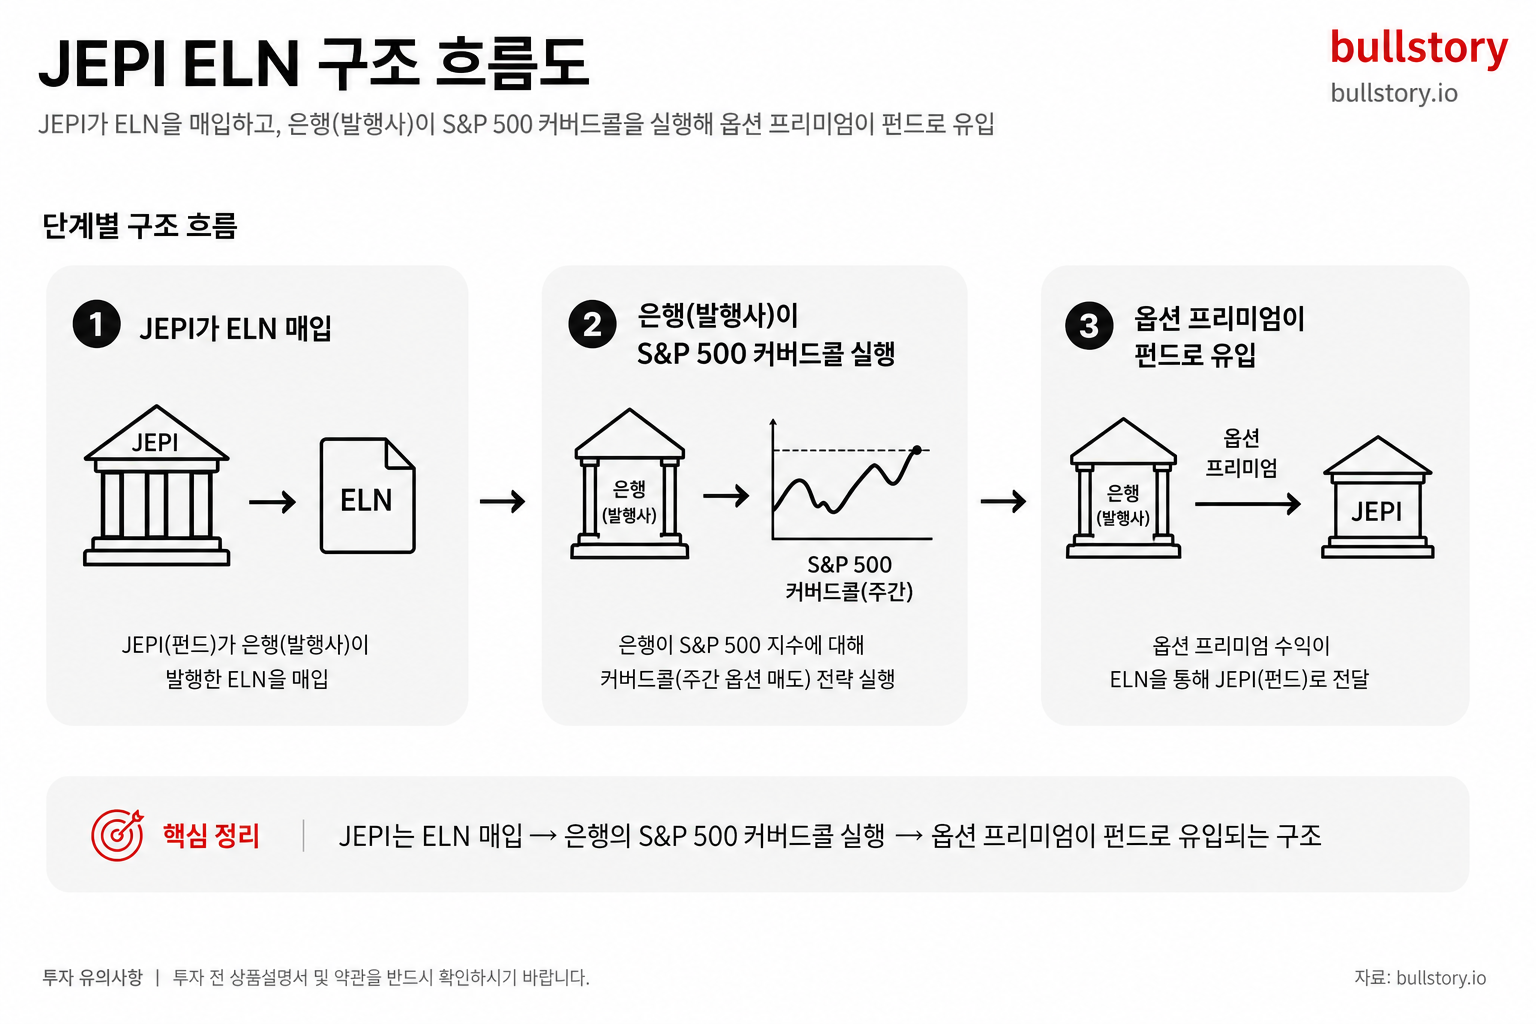
However, manager Hamilton Reiner indirectly captures that return by having the fund buy ELNs instead of selling the call options directly.
An ELN is a structured bond issued by banks and other financial institutions. If JEPI buys these bonds,500 the issuing financial institution carries out an S&P covered call strategy and returns the proceeds to JEPI. In other words, the ETF does not sell call options directly, but outsources that to the financial institution.
The call options are executed on a weekly basis, staggered by different maturities. This helps reduce the risk that a single market surge at one point in time will hit the entire distribution all at once. Another structural advantage is that stock selection and option income generation are separated, allowing each role to be optimized independently.
At present, JEPI invests about 15% of total assets in ELNs, which is below the regulatory ceiling of 20%.
How It Differs from a Typical Dividend ETF
| Category | Typical Dividend ETF (e.g., SCHD) | JEPI |
|---|---|---|
| Source of returns | Dividends from held stocks | Stock dividends + option premium |
| Dividend level | Annual 3~4% range | Annual 7~9% range |
| Participation in rising markets | Receives the stock’s gains in full | Upside above the call option strike price is limited |
| Distribution volatility | Relatively stable | Changes monthly depending on market volatility |
Unlike typical covered call ETFs that sell options directly on the stocks they hold, JEPI more efficiently captures option premiums through ELNs. That means there is one more layer in the structure.
Because of this structure, JEPI can use the premiums it receives to pay them out to investors as dividends. By contrast, competing ETFs that directly sell call options may pay out part of the premium as capital gains or capital return, and in that case the actual cash dividend may be lower.
Why the distribution changes every month is here
JEPI’s income varies depending on market volatility. When the market is choppy, option premiums rise and distributions increase as well. When the market is calm, premiums fall and distributions also decline.
In practice, over one year, the monthly distribution ranged from per share to per share. The difference between the low and high was as much as percent.2025In practice, over one year, the monthly distribution ranged from per share to per share. The difference between the low and high was as much as percent.0.326In practice, over one year, the monthly distribution ranged from per share to per share. The difference between the low and high was as much as percent.0.540In practice, over one year, the monthly distribution ranged from per share to per share. The difference between the low and high was as much as percent.66In practice, over one year, the monthly distribution ranged from per share to per share. The difference between the low and high was as much as percent.
JEPI is not a bond that pays a fixed interest rate. The distribution amount is determined by the option premium collected each month. It would be a mistake to assume you receive the same annual8 % every month. In some months, you get more, and in others, much less.
The relationship between distributions and the VIX (the market fear index, an indicator of how uneasy the market is) is covered in detail in the section 'Why distributions differ every month'.
The other side of this structure, that is, how taxes are applied from the perspective of Korean investors is separately organized in <strong>'Korean investor tax checklist'</strong>.
JEPI, you only need to buy before the ex-dividend date 2026year payment schedule, fully summarized
The ex-dividend date for JEPI (JPMorgan Equity Premium Income ETF) is the first business day of each month, and the payment date is at the beginning of each month, 2 to 4 business days later. In simple terms, you must hold the stock until the close of trading on the day before the 1th day (based on business days) to receive that month’s distribution. The current annual dividend yield is about 8% range, and over the past 1 years it paid 4.57 dollars per share (based on JPMorgan Asset Management disclosure).
What exactly is the ex-dividend date?
Buying a stock does not automatically mean you will receive that month’s dividend. The ex-dividend date is the reference date that determines who is entitled to receive that month’s distribution. After this date passes, that month’s distribution goes to the previous holder, not the next holder.
For example 6to receive the 6month distribution, you had to hold the stock before the ex-dividend date on the 1day. In the official PDF from J.P. Morgan Asset Management, the ex-dividend date and the record date are shown as the same date, so in practice it is often enough to check only the ex-dividend date.
2026JEPI ex-dividend and payment date schedule for the year
Below is based on the official ETF dividend calendar released by J.P. Morgan Asset Management for the year 2026. Because all schedules may change, be sure to check the latest notice once more on the J.P. Morgan Asset Management website right before buying.
| Month | Ex-dividend date (hold through the previous day) | Payment date (deposited to account) |
|---|---|---|
| 2month | 2026year 2month 2day | 2026year 2month 4day |
| 3month | 2026year 3month 2day | 2026year 3month 4day |
| 4month | 2026year 4month 1day | 2026year 4month 6day |
| 5month | 2026year 5month 1day | 2026year 5month 5day |
| 6month | 2026year 6month 1day | 2026year 6month 3day |
| 7month | 2026year 7month 1day | 2026year 7month 6day |
| 8month | 2026year 8month 3day | 2026year 8month 5day |
| 9month | 2026year 9month 1day | 2026year 9month 3day |
| 10month | 2026year 10month 1day | 2026year 10month 5day |
| 11month | 2026year 11month 2day | 2026year 11month 4day |
| 12month | 2026year 12month 1day | 2026year 12month 3day |
(Source: J.P. Morgan Asset Management 2026ETF Dividend Calendar Official PDF)
7Monthly distribution is 0.387dollars per share, the ex-dividend date is 7month 1day, and the payment date is 7month 6day. 8The monthly ex-dividend date is 8month 3day, and the distribution per share is expected to be between 0.3678~0.4066dollars.
8Why the monthly ex-dividend date is not 1day
Looking at the table, only the 8monthly ex-dividend date is marked as 3day. The reason is the impact of federal market holidays. If the NYSE is closed, trade processing and recordkeeping are delayed, so if the date falls on a holiday, the ex-dividend date moves to the next business day. 8month 1day was a Saturday, so the ex-dividend date was moved to 8month 3day Monday.
Money may not arrive immediately on the payment date
The payment date is the day the manager withdraws the distribution. The time it actually appears in an investor’s account can vary depending on the broker’s processing speed, the time zone, and the impact of weekends and holidays. If you use a domestic securities firm, the deposit can sometimes be delayed by a day or two. If you need the money in your account by an exact date, plan with 1~2 days of extra time before the payment date.
JEPI’s ex-dividend date and payment-date structure are not complicated. You only need to remember one thing. If you buy before the market close on the day before the first business day of each month, you become eligible for that month’s distribution. However, that is a separate issue from whether you should make an investment decision based on the currently stated annual dividend yield of 8%. The reason the comparison of the dividend yields of JEPI and SCHD is not simple will be covered in the next section.
Actual return simulation by bullish and bearish scenarios
1,000If ten thousand won is invested in JEPI, 1how much is earned in a year.
If the simple annual dividend yield 8% is applied, it is ten thousand won. But the total return actually in hand is more complicated.80The total return actually in hand is more complicated.
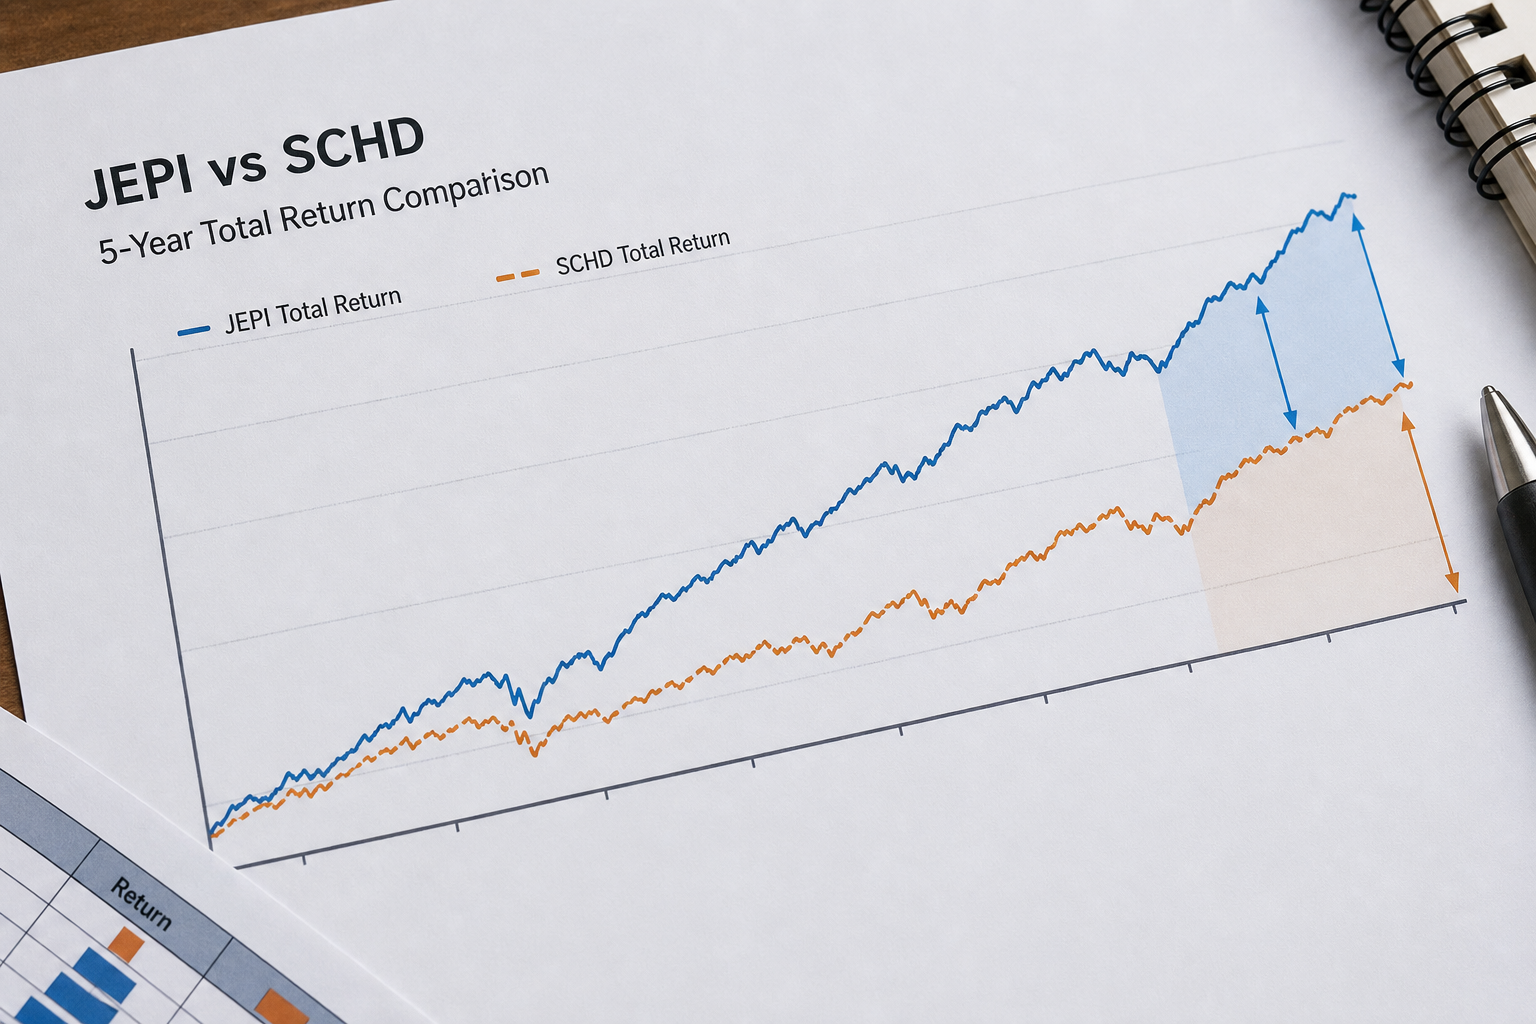
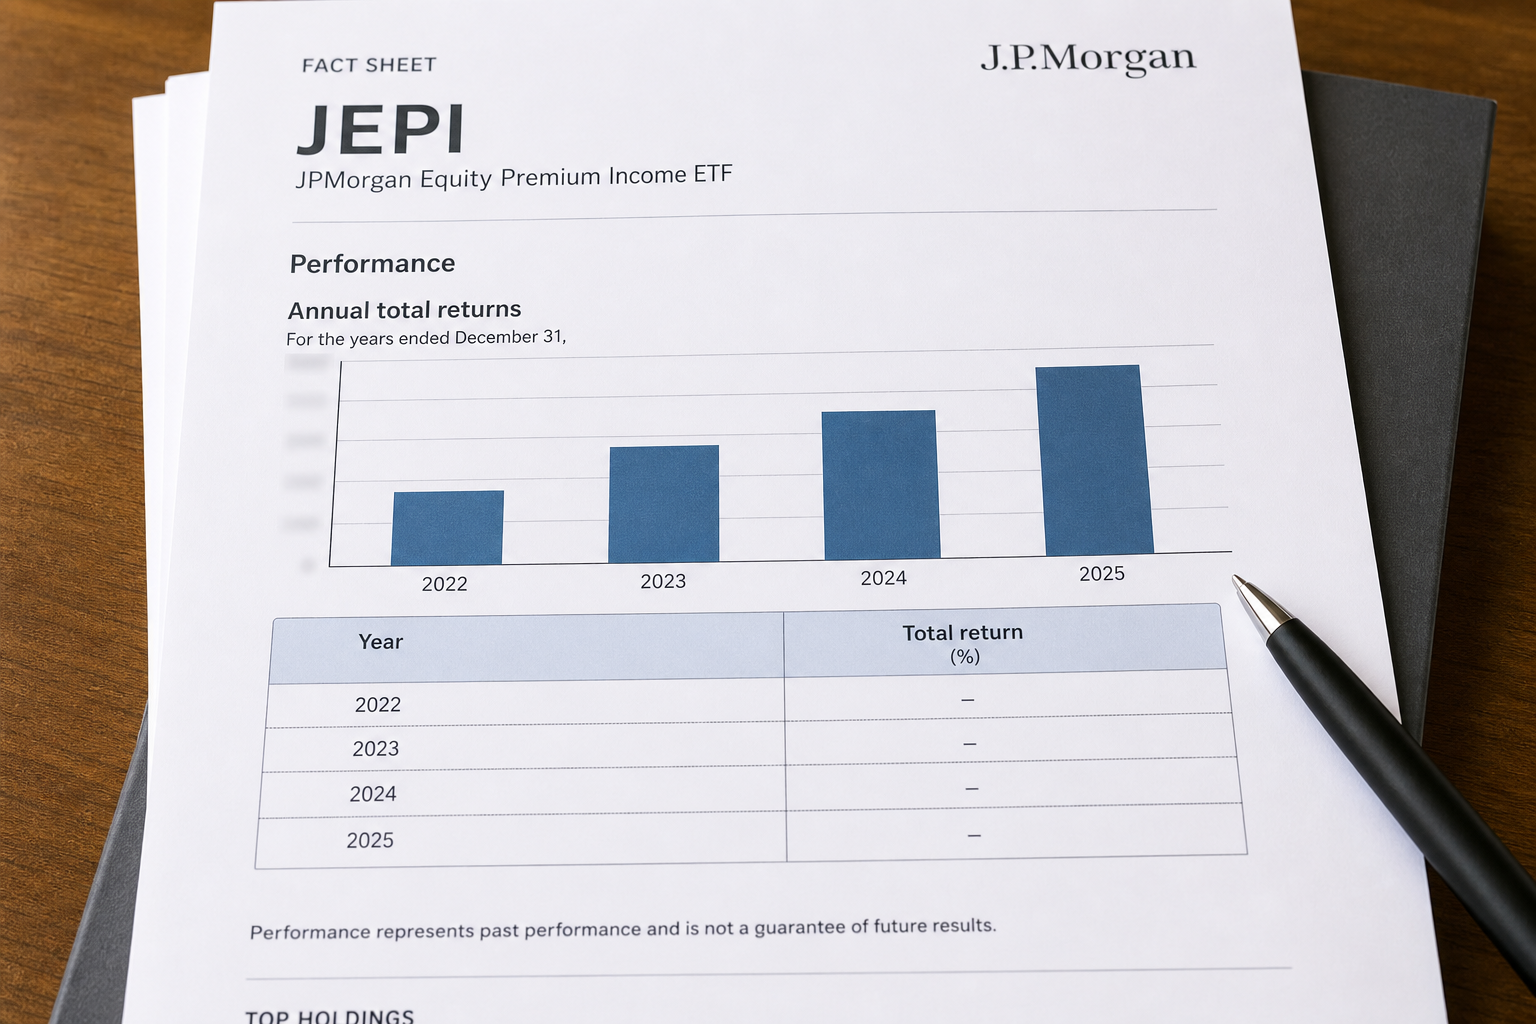
Based on J.P. Morgan disclosures, annual total return by year, including dividend reinvestment, varied greatly from year to year (see table below).
How total returns actually differed by year
The table below summarizes JEPI's yearly performance based on the J.P. Morgan Fact Sheet and data from financecharts.com.
| Year | JEPI total return (including distributions) | S&P 500 total return |
|---|---|---|
| 2022 year | -3.49% | -18.11% |
| 2023 year | +9.83% | +26.29% |
| 2024 year | +12.56% | +25.02% |
| 2025 year | +8.10% | +17.88% |
One pattern is clear here. Defensive in down markets, lagging in up markets.
For example, when the S&P 2022 in year 500 fell by 18.11%, JEPI held the downside to a considerable extent. Income from option premiums served as a cushion.
In the recent bull market, by contrast, some of the index gains had to be given up. That is because of the covered-call structure. The purpose of this design was covered in detail in the previous section, “Why a simple comparison of JEPI and SCHD dividend yields is risky.”
1,000How much was earned by year when investing ten thousand won
Let’s convert it into numbers that real investors can feel. 2022At the beginning of the year 1,000is the scenario of someone who put ten thousand won into JEPI.
| Year | Beginning-of-year valuation | Annual total return | End-of-year valuation (pre-tax) |
|---|---|---|---|
| 2022year | 1,000million won | -3.49% | 965million won |
| 2023year | 965million won | +9.83% | 1,060million won |
| 2024year | 1,060million won | +12.56% | 1,193million won |
| 2025year | 1,193million won | +8.10% | 1,290million won |
4Over the years, cumulatively, that is about 29% gain versus principal.
If you simply assume an annual 8% dividend, it is 32%. On the surface, it looks similar.
But do not be fooled by the superficial similarity. 2022The share-price decline in the year first ate into principal, and it took time to recover.
After that, in the bull markets of 2023and 2024years, it lagged the S&P 500by nearly about 20percentage points.
Bull Market vs. Bear Market, Which Is More Favorable?
Bear market scenario. 2022In a year when the market falls 20% or close to it, JEPI’s defensive effect becomes clearly visible.
1,000On a ten-thousand-won basis, the S&P 500shows a 180ten-thousand-won loss, while JEPI limits the loss to 35ten-thousand won. Dividend income partly offset the decline.
Bull market scenario. The problem is when the market rises strongly.
If you had put the same 1,000ten thousand won into the S&P 2023~2024in 500ten-thousand won it would have grown to about 1,570ten thousand won.
JEPI is about 1,240ten thousand won over the same period. The difference is 330ten thousand won. The key point is that this gap appears even while receiving dividends.
In the end, the break-even point is this: JEPI is competitive when the market rises or falls by less than 10% on an annual basis. If the market rises by 15% or more per year, it is hard to match the index’s gains through dividend income alone.
Looking only at the distributions
Based on the most recent 1 years, JEPI has paid out 4.57 dollars per share in distributions. At the current share price, the dividend yield is around 8.04% per year (based on stockanalysis.com).
1,000For an investor with ten thousand won, the annual distributions received are about twenty-four thousand won before tax, or an average of 80 to 6 thousand won per month.7.
However, the same amount does not come in every month. Some months are higher, and some months are lower. The reason is explained in detail in the next section, "Why are the distributions different every month?"
Why the distribution amount changes every month
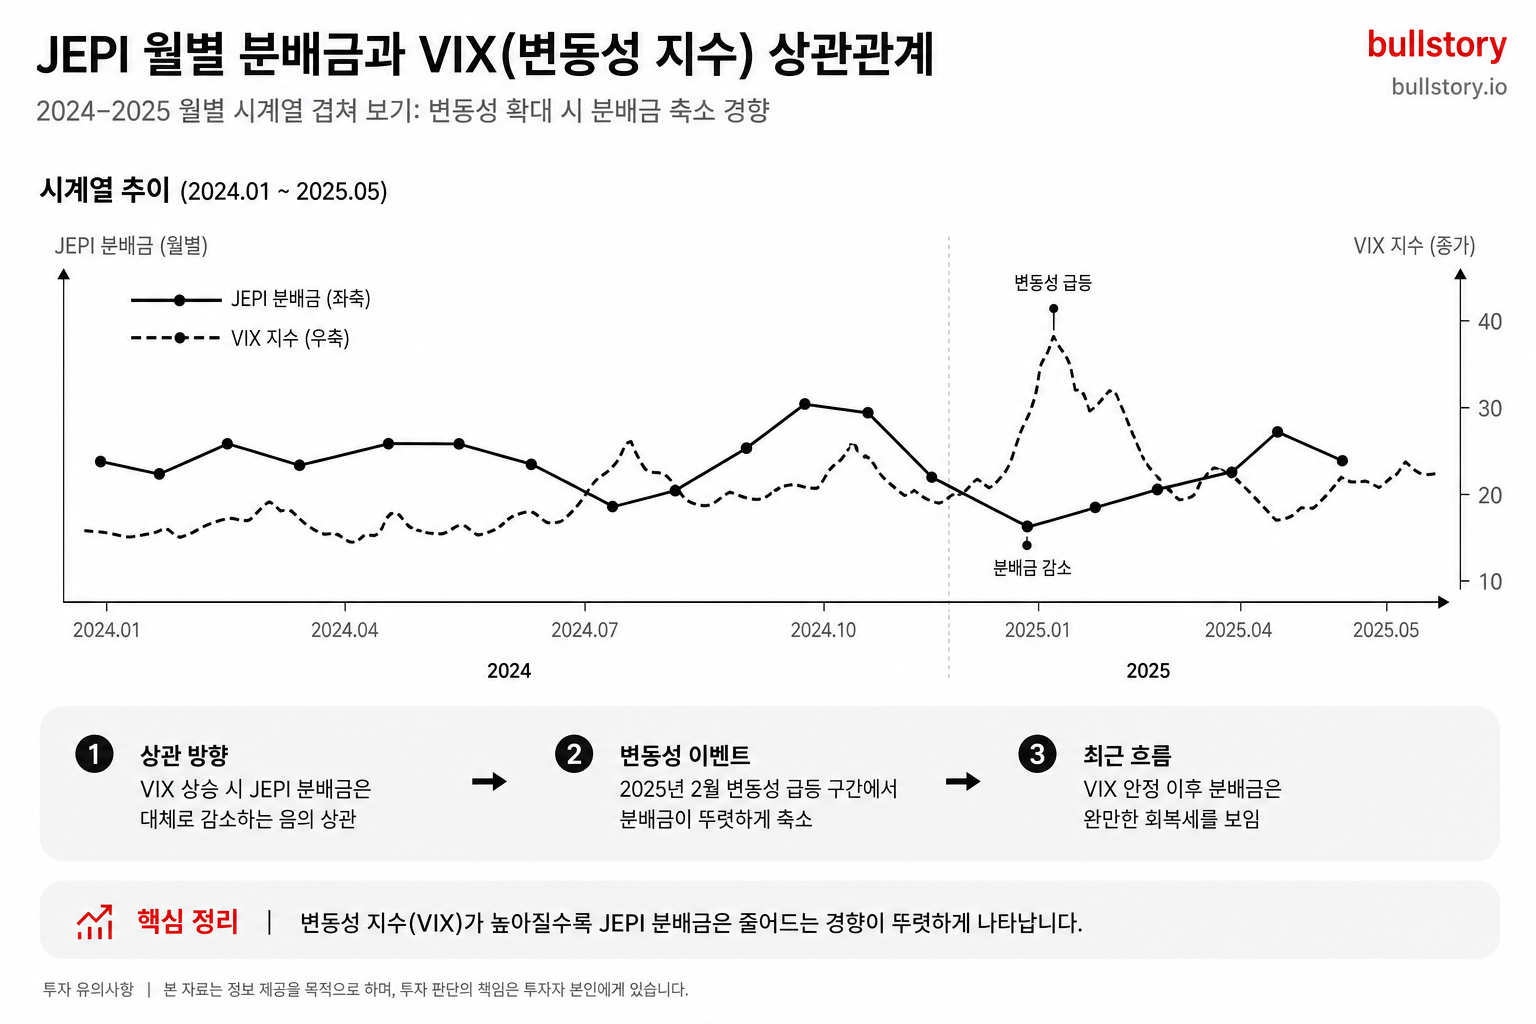
JEPI’s monthly distribution is not a fixed amount. 2024During the year, the monthly distribution per share was 1about 0.29dollars to 0.40dollars. Even within the same year, the gap between the high and the low widened by as much as 38%. The reason is one thing: the return on ELNs (equity-linked notes, bonds issued by banks with an embedded short-option position) that fund JEPI’s distributions is the option premium itself, and the premium moves in direct proportion to market volatility.
When the VIX rises, the distribution rises; when it falls, it falls
VIX (the CBOE Volatility Index, a measure that market participants use to estimate how much S&P500will fluctuate in the future) is the key. The higher the volatility, the more expensive options become. When uncertainty increases, option buyers are more likely to profit, and sellers therefore demand a higher premium. JEPI is the side that receives that premium. When the VIX is high, the monthly distribution received by JEPI investors increases, and when volatility eases, the premium shrinks and the distribution also declines accordingly.
Looking at the actual figures, this relationship stands out clearly.
| Market environment | VIX characteristics | Annual distribution yield (based on ex-dividend date) |
|---|---|---|
| 2022year (bear market) | high, annual average 25~30 | about 12% |
| 2023~2025year (bull market) | low, annual average 15~17 | about 8% |
| 2026year 6month (current) | stabilization phase | about 8.1% |
2022The reason the annual return was unusually high was that the bear market in that year pushed option premiums higher.8Since then, as the market stabilized, it converged to the low single digits.
The month with the smallest distribution, the month with the largest distribution
2026In 6the monthly distribution in 0.39was dollars per share, but compared with 1years earlier, in 2025the monthly distribution in 6was dollars, and it was 0.54lower than that.28As VIX fell, the distribution fell with it. When VIX is subdued, call option premiums shrink, and JEPI passes that reduced income directly to investors.
This should not be read as an "abnormal sign." The safety of distributions for covered call ETFs like JEPI is judged by a single criterion: whether the fund is paying out only what it actually earned, or whether it is making up the difference by cutting into NAV (net asset value, the fund's actual per-share value). JEPI has a structure that distributes only what it earns, so if the distribution has fallen, that is the result of a calmer market, not something unusual about the fund.
Why you should not expect distributions to rise
There is one counterintuitive fact. JEPI's distributions do not rise in a straight line over the long term. Because the distribution structure moves with macro volatility indicators such as VIX, the distribution growth rate (CAGR) for 5years is -1.12negative. Rather than rising by 8every year, distributions also tend to move lower when the market is calm.
Looking at the most recent 3 years, the months in which the distribution amount rose and the months in which it fell repeated at nearly the same frequency, with 19 rises and 18 declines. The up-and-down pattern is structural.
The conclusion is simple. JEPI distributions grow thicker when the market gets scared, and thinner when the market is calm. If you are planning to live off them as monthly spending money and expect the same amount every month, you need to factor in that swing in advance (2024-year basis, the gap between the high and low was 38%).
How much you should hold so that this volatility stays at a manageable level is examined in the next section, 'Portfolio Allocation Guide,' broken down by retirees, 30-something dollar-cost averaging investors, and income-supplementing types.
How much should you allocate to JEPI: a weighting guide by investment purpose
JEPI dividend yield (2026-7-month basis, roughly 8.19% annualized, based on Investing.com) is a fairly clear number. The share it should take in a portfolio depends entirely on "who you are."
For retirees, 40~50% or more is possible, and for 30-something dollar-cost averaging investors, 10~20% is close to the upper limit. Purpose and life stage come first; the dividend yield figure comes after that.
Retirees: JEPI can be used as a core, but it should not be left alone
Retirees are not trying to double their money. They need to create living expenses now while also protecting principal for the decades ahead. When you want both at the same time, JEPI has a place that fits.
JEPI has an annual8dividend rate in the500high single digits, and historically its distribution amount has been relatively stable, with downside in bear markets also fairly shallow. That is thanks to the lower volatility structure of the S&P versus Nasdaq. That is why among retirees who want JPMorgan's covered-call structure (covered call refers to a strategy of selling call options on held stocks to receive monthly premiums), investors who prefer defensive stock-based exposure tend to choose JEPI.
But relying on JEPI alone to finish a retirement portfolio is another matter.
If you can tolerate distribution volatility and have a pension or other income source, JEPI is useful. However, if you put everything into JEPI based only on an annual8dividend rate, you lose participation in the upside and monthly cash flow also becomes hard to predict.20For a retirement period of30years, both of these are significant sacrifices.
If you place a dividend-growth ETF such as SCHD (Schwab U.S. Dividend ETF) alongside it, you can secure current cash flow while also20protecting against the problem of purchasing power falling after30years.
Suggested allocation for retirees (reference basis)
| Item | Allocation | Role |
|---|---|---|
| JEPI | 35~45% | Monthly cash flow focus |
| Dividend-growth ETFs such as SCHD | 40~50% | Long-term inflation protection |
| Cash · short-term bonds | 5~15% | Living-expense buffer 3~6months |
Set aside a buffer for living expenses 3~6for several months, and use months with higher distributions to refill the buffer; this approach fits this structure well.
30For dollar-cost averaging investors: JEPI is a supporting actor
Monthly dividend products like JEPI can either sit at the center of a portfolio or remain a supplementary source of cash flow. If you are in a phase of growing assets, total return and after-tax reinvestment efficiency matter more than a high distribution rate.
30is an asset.
In strong bull markets, JEPI lags the market. That gap widens over time, and if you have a long retirement period ahead of you, this difference can feel significant. In fact, as of recent 1years, JEPI’s return was 8.49%, and during the same period S&P 500was 13.47%.
For an investor building assets through recurring contributions, allocating 10~20% of the portfolio to JEPI or a similar covered-call ETF is a reasonable way to stabilize monthly cash flow while lowering overall volatility.
30 Recommended allocation for recurring-contribution investors (reference benchmark)
| Item | Allocation | Role |
|---|---|---|
| S&P 500 / QQQ and other growth ETFs | 60~70% | Long-term compound growth |
| SCHD and other dividend-growth ETFs | 15~25% | Gradual dividend expansion |
| JEPI | 10~20% | Monthly cash-flow support |
It is natural to keep growth assets such as VTI, VOO, SCHD, and QQQ as the core, and to place JEPI in the cash-flow role. The key point is not to end the portfolio with JEPI alone, but to place it in the cash-flow slot while keeping the growth slot separate.
Cash-flow support purpose: 10~30% is a reasonable upper limit
If you are an investor who wants to cover part of your spending with monthly distributions while working, or replace part of your living expenses with JEPI distributions, what about that?
If you are an accumulation-phase investor, rather than taking a large JEPI allocation, it is more natural to view it as a cash-flow supplement within 10~30% of total assets.
When deciding on the allocation, you should first look at not "how much more you receive" but whether your living expenses will stay on track even in months when the distribution is reduced. For example, if JEPI accounts for 50% of monthly living expenses, then living expenses also shrink in months when the distribution is reduced. This structure is psychologically quite tiring.
Design the allocation so that distributions do not exceed half of living expenses. That is the most important principle for this purpose.
Three common principles
- Avoid holding JEPI at 100%. JEPI can play a role in a retirement income plan, but it should not be the only asset you hold.
- Do not raise your allocation in a bull market. If you sharply increase your position because both principal and distributions look strong in a tech-led rally, the portfolio’s overall perceived volatility can rise during a correction.
- Distributions are not a fixed monthly salary. JPMorgan’s materials also say that JEPI aims for monthly distributions, but does not promise to keep the distribution amount fixed. First calculate whether you can keep living even if distributions fall, and then decide your allocation.
Seeing monthly dividends hit your bank account is appealing to anyone. Whether that number is sustainable depends on what other portfolio holdings you pair it with. In the next section, we look at how much tax is actually applied to these distributions, and at the threshold for the comprehensive financial income tax that Korean investors can easily overlook (a system in which, if annual financial income 2,000won exceeds, it is combined with other income and a higher tax rate applies).
Tax checklist for Korean investors
The tax structure that Korean investors receiving JEPI distributions should understand first is clear. Under the U.S.-Korea tax treaty, 15% of dividend income is first withheld in the United States. The amount shown in your brokerage account is already a number after 15% has been taken out. But that is not the end. Additional tax may arise depending on the annual financial income total after withholding (interest + dividends).
1Step: U.S. withholding tax 15%, automatically deducted
Before JEPI distributions reach your bank account, the U.S. Internal Revenue Service (IRS) first takes 15%. Investors do not need to file separately or make a separate payment. It happens automatically.
U.S. ETF dividends can be subject to a 15% withholding in the United States before they reach your account.
For example, even if an ETF is listed with an annual dividend yield of 8%, if 15% is withheld in the United States, the yield you actually feel in your account drops to about 6.8%.
This is exactly why you should not take JEPI’s dividend yield of 8% at face value. There is already at least a 15% gap from the outset between the pre-tax figure and the after-tax amount received.**
2Step: Comprehensive taxation of domestic financial income, the benchmark is annual 2,000million won
If annual financial income (interest + dividends combined) is 2,000million won or less, U.S. withholding tax of 15% is often the final treatment. At this level, there are many cases with no additional filing or taxation.
On the other hand, 2,000if it exceeds ten thousand won, there is an obligation to file comprehensive income tax returns, and when combined with other income, a progressive tax rate applies.
If annual interest and dividends combined exceed 2,000ten thousand won, it becomes subject to comprehensive financial income tax, and when combined with other income, a rate of up to 49.5percent may apply.
A progressive tax rate is a structure in which a higher tax rate is applied as income increases. If you are an office worker whose earned income is already high, you can think of JEPI distributions as being added on top of that.
This 2,000won threshold is reached sooner than you might think
Many investors feel reassured, saying, "My JEPI distributions are only 1,500won a year." That is where the trap lies.
If you look only at dividend ETFs, it is 1,700won.
If bank deposit interest of 400won is added here, the total becomes 2,100won.
“My dividends were 2,000less than ten thousand won?” would be only half right. Taxes are calculated by aggregating by income type, not by individual stock.
JEPI’s monthly distributions may look small each month, but 12when you add up several months, they grow faster than you might expect. If you receive them through multiple brokerage accounts, the total can cross the threshold without you realizing it.
| Financial income bracket | Tax treatment | Key points to check |
|---|---|---|
| Annual 2,000ten-thousand won or less | Separate taxation (U.S. withholding 15%, so in most cases that settles it) | Be sure to check the combined amount across all brokerages yourself |
| Annual 2,000ten-thousand won and above | Comprehensive taxation of financial income (combined with other income, progressive tax rates) | 5monthly comprehensive income tax filing obligation arises |
Health insurance premiums also change
There is one more item to watch besides comprehensive taxation: health insurance premiums.
For workplace-insured subscribers, if other income besides earned income (including financial income) exceeds annual 2,000ten-thousand won, then for the excess amount 7.09you must pay an additional amount each month equal to the excess multiplied by the percentage.
For local subscribers, if annual financial income exceeds 1,000thousand won, health insurance premiums are charged on the entire financial income, not just the excess.
In the case of dependents, if combined income including financial income exceeds annual 2,000thousand won, dependent status is revoked.
Local subscribers have a lower threshold. At annual 1,000thousand won, and on a monthly distribution basis at around 83thousand won, it already comes into health insurance premium calculation.
Using tax-efficient accounts: understand the structure before you use them
To reduce the tax burden, you should consider using tax-exempt and tax-deferred products such as ISA (Individual Savings Account) or pension accounts (IRP, pension savings). However, you should move only after first understanding the account structure.
-
ISA account — foreign collective investment securities are excluded from the scope of assets under management. JEPI cannot be placed in an ISA as is. Instead, you need to access it through a similar covered call ETF listed in Korea.
-
ISA tax-free limit — upon maturity and cancellation, the tax-free limit is for the basic livelihood support type 400 thousand won for the general type 200 thousand won.
-
ISA tax rate comparison — amounts above the limit are subject to separate taxation at 9.9%. This is a more favorable structure than the 15.4% applied in a regular account.
-
Retirement savings·IRP — In a retirement savings account or IRP account at a Korean securities firm, only ETFs listed in Korea can be held. Therefore, JEPI, which is directly listed in the United States, cannot be included. Instead, when retirement benefits are received, only 3.3~5.5% in pension income tax is levied, so from a long-term holding perspective, the tax burden is reduced.
-
Regular overseas stock account — the only account through which you can directly buy the original U.S. JEPI. If you hold JEPI in a regular account, the larger the distributions become, the more quickly you need to manage financial income. You must also consider the effects of comprehensive taxation and health insurance premiums.
Checklist to Review Before Investing
If even one of the items below applies, be sure to check it before buying.
- Do your annual combined financial income, including other financial income such as deposit interest, CMA interest, and domestic stock dividends, exceed 1,500ten thousand won? If JEPI distributions are added in this case, 2,000the ten-thousand-won level can be filled up quickly.
- Are your accounts spread across multiple securities firms? It is easy for the aggregate total to become unclear. Check directly through the Hometax financial income inquiry.
- Are you maintaining dependent status under health insurance? Once combined income exceeds annual 2,000ten thousand won, dependent status is revoked.
- Are you an insured person in a local plan? If annual financial income exceeds 1,000ten thousand won, all financial income is included in the health insurance premium calculation.
- Have you already opened an ISA account? The moment you are notified that you are subject to comprehensive taxation on financial income, the ISA account is effectively forcibly closed, switches to a "locked account," and no further buying becomes possible.
The tax system varies depending on the composition of each individual's income. This article is a guide to understanding the structure, and for actual filing and tax-saving decisions, it is accurate to check with a tax professional or with the National Tax Service Hometax (National Tax Consultation Center 126).
Appendix: Glossary
The terms that appeared throughout this article 6have been organized here. If you got stuck because of a word you were seeing for the first time, you can look it up here.
-
Covered Call: A strategy of holding a stock while at the same time selling someone else the right to buy that stock at a specific future price, known as a call option. It means buying the stock and selling the call option together. A call option is the right to buy a stock after a certain period. In return, you receive an option premium every month. The trade-off is that if the stock price rises sharply, you cannot keep that upside. It is a structure that swaps cash flow for upside potential.
-
Option Premium: The contract payment received when selling a call option. It is easy to think of it as rent received for lending out a stock. The reason JEPI’s dividend yield is higher than that of ordinary dividend-stock ETFs is precisely because this premium income is added. Monthly distributions come from two engines: dividends from the stocks held and option premiums received through ELNs. This premium varies depending on market volatility.
-
ELN (Equity-Linked Note): A bond-form contract that JEPI buys from a bank counterparty instead of using options directly. This contract brings into the fund the same profit and loss as selling S&P 500 call options. In simple terms, it is a way for JPMorgan to receive option income through a bank as an intermediary without going directly into the options market itself. Thanks to this structure, option premiums are classified as interest income and flow into the fund in full.
-
Ex-Dividend Date: If you buy a stock after this day, you will not receive that month’s distribution. To receive the dividend, you must buy by the day before the ex-dividend date. Even if you buy shares on the record date, which is the date used to finalize the shareholder list eligible to receive the dividend, you cannot receive the dividend. U.S. stock trades settle on T+1 plus 1 business days after the trade date.
-
NAV (Net Asset Value): The value of all the assets actually held by the ETF divided by the number of shares. It is almost the same as the share price, but not exactly identical. When JEPI trades at a price slightly above NAV, it is called a premium. After the ex-dividend date, it is normal for NAV to fall by the amount of the distribution. So, the text repeatedly pointed out that looking only at the dividend yield number can lead to an incorrect calculation of the real return.
-
TTM Dividend Yield (Trailing Twelve Months Yield): The figure obtained by dividing the total distributions actually paid over the past 12 months by the current share price. The most recent annual dividend per share divided by the share price, it is not a figure that predicts the future but a number that looks back at past performance. JEPI’s dividend yield 1% range usually uses this standard. In a year when market volatility was low, TTM can come out lower than the amount actually received in the future, and in a year when volatility was high, the opposite can be true. This is why you should not blindly trust a single number.8. Since the hidden fact was omitted and restored separately, the translated text here preserves the surrounding explanation only.
Frequently asked questions
JEPI 100What is the weekly dividend?
Before tax, annual per-share 4.59dollars, so if you hold 100shares the annual amount is 459dollars, and the monthly average is about 38~39dollars.
What are the drawbacks of JEPI?
In a strong market, upside is limited and the monthly distribution amount varies, so it is uncertain. There is also the credit risk of the ELN issuer and 0.35a fund expense ratio burden.
What is JEPI’s dividend yield?
2026As of 7[month omitted]8.27the forward dividend yield is 8It is typically stated in the low-[percentage omitted] range and is a figure based on the fund’s disclosure.
How do you check JEPI’s dividend dates (ex-dividend and payment dates)?
The ex-dividend date and payment date change every month. For example, the ex-dividend date in 2026[year omitted]7[month omitted]2026[year omitted]7[month omitted]1[day omitted], and the payment date is 2026[year omitted]7[month omitted]6[day omitted]. Check the fund’s monthly calendar.
How do you calculate JEPI dividends?
The calculation method is to multiply the number of shares held by the annual per-share 4.59dollars. Example: 100shares receive 459dollars a year.
What is JEPI's dividend record (monthly payout)?
The monthly payout is variable. It usually moves in the range of 0.35~0.50dollars per share, and you can refer to the annualized per-share 4.59dollars.