Bullstory Research August 3, 2026
The real reason Wall Street heavyweights are increasing their allocations amid the sharp drop in gold prices
Key takeaways
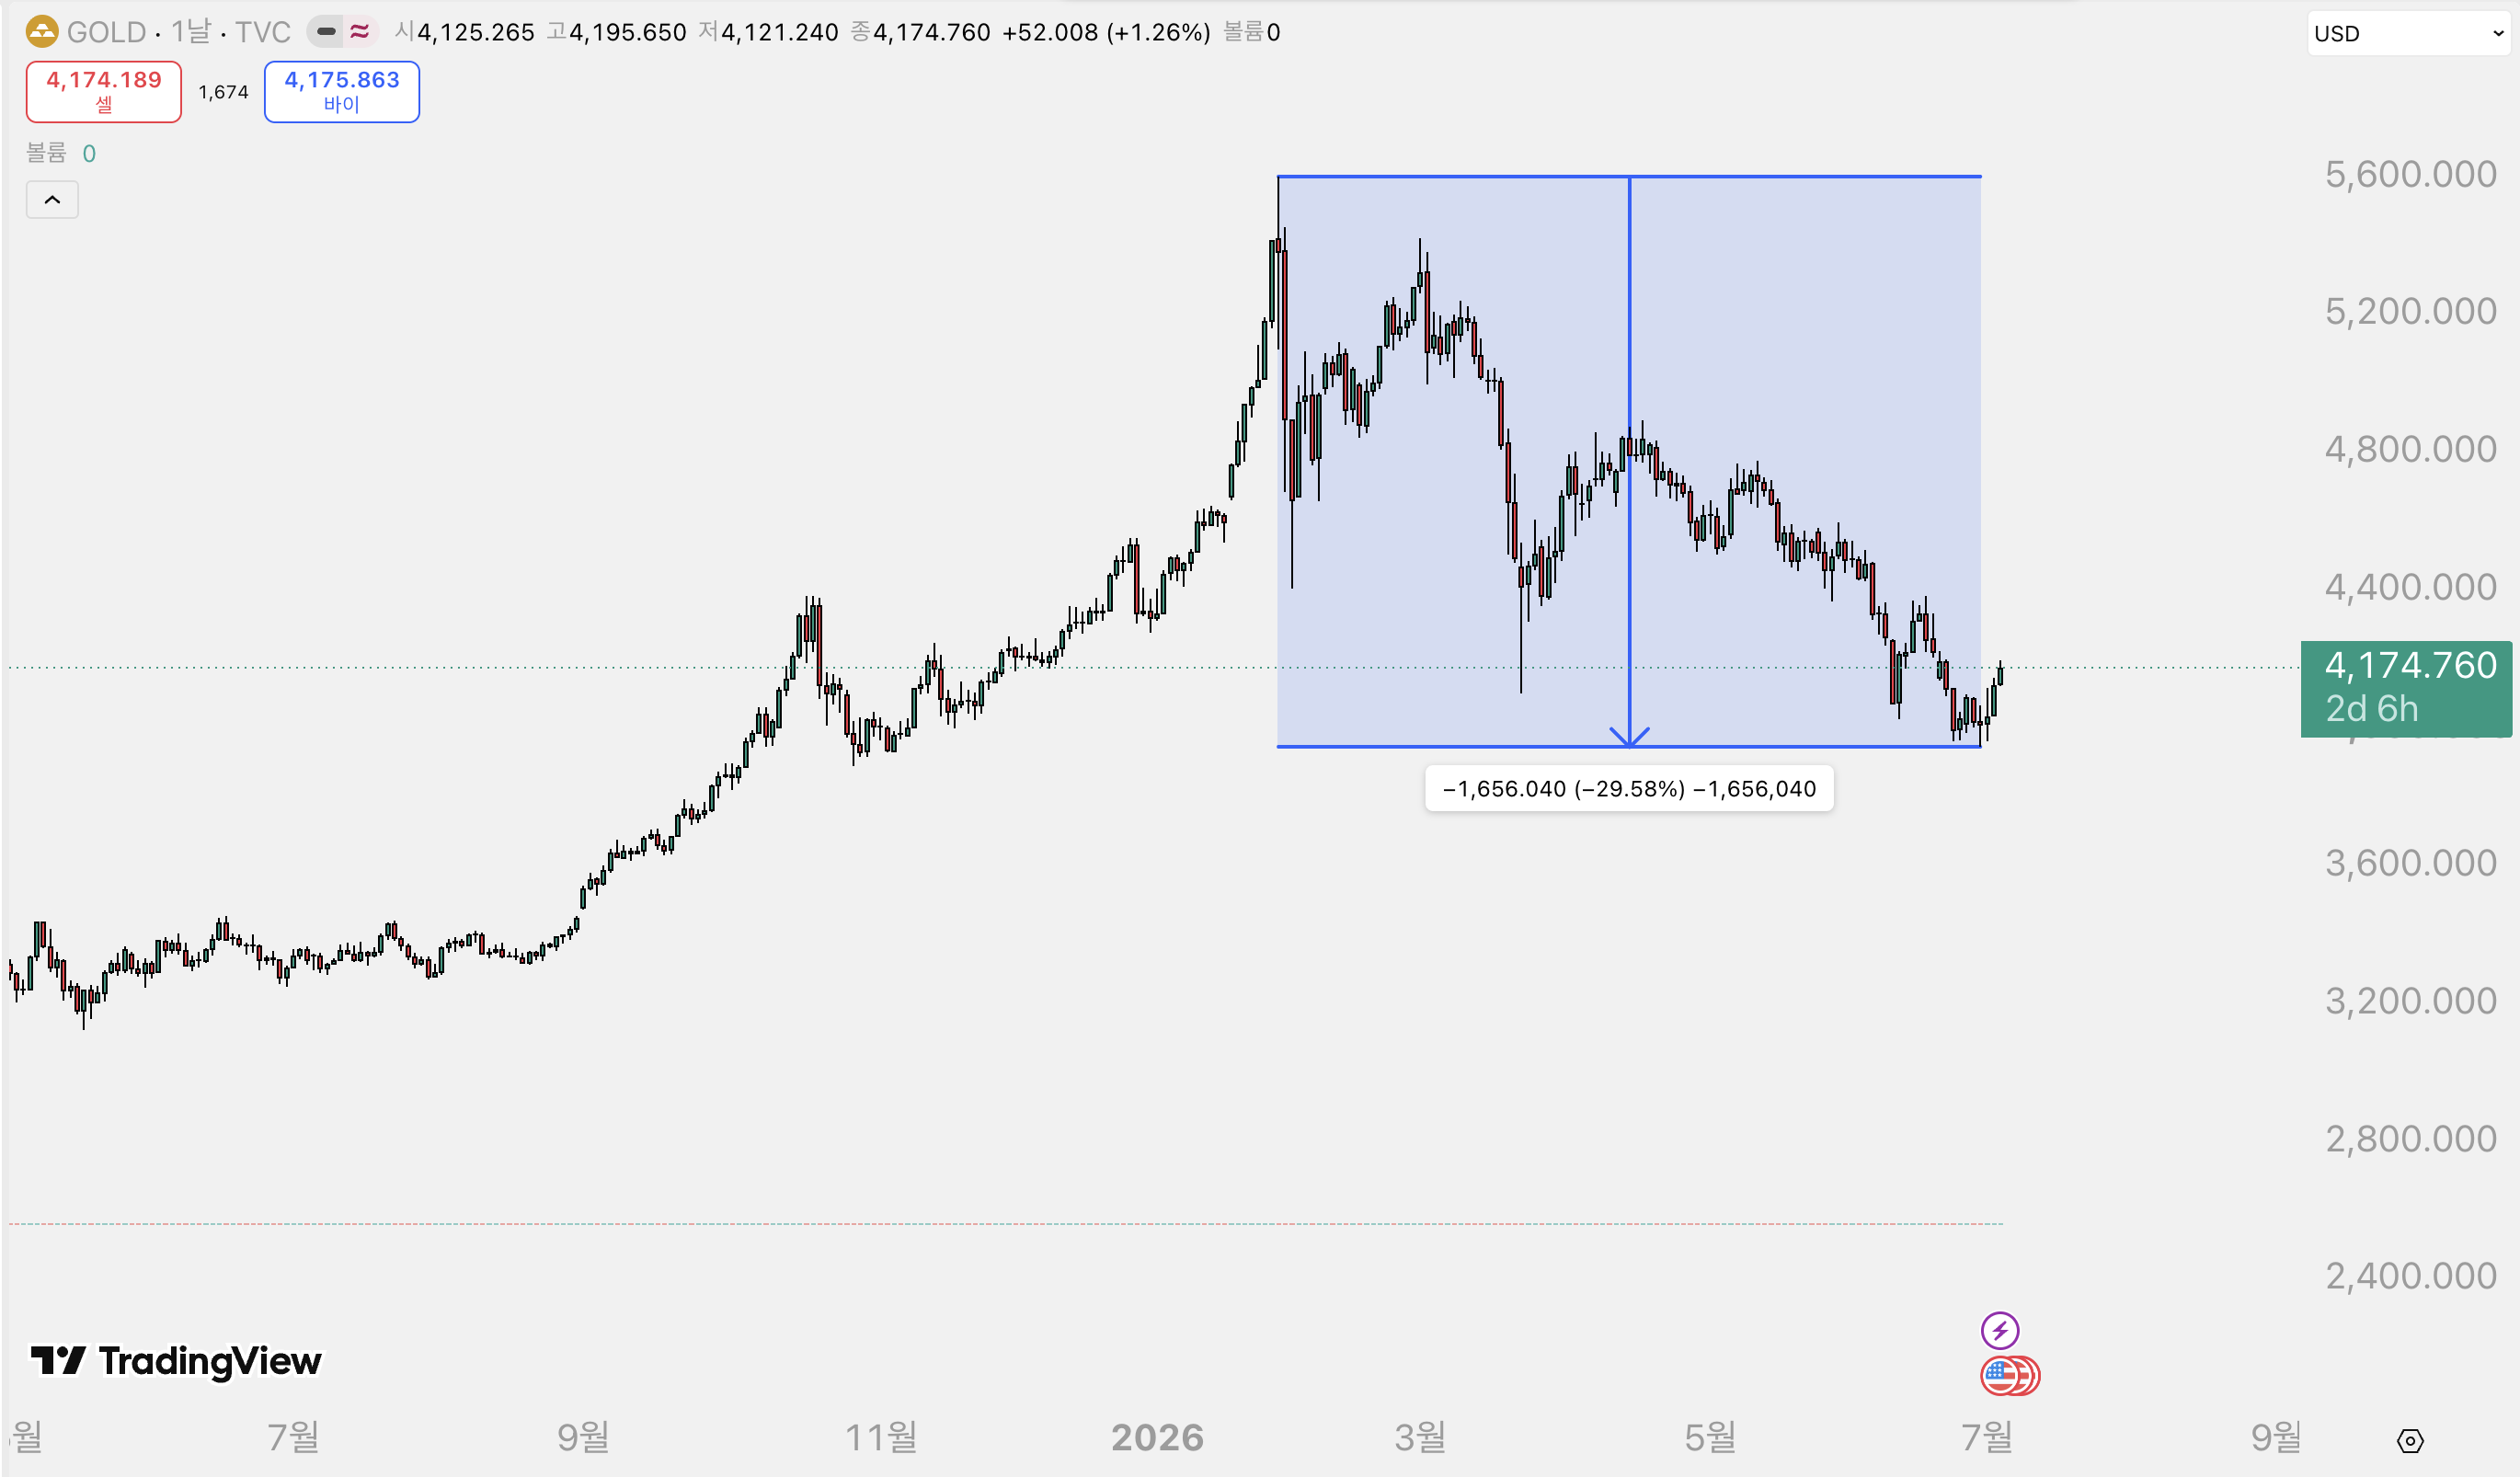
2026in 1gold hit per ounce 5,500dollars and fell 6months later by 16%. However, Wall Street and major central banks recommend increasing gold exposure on the grounds of geopolitical risk, expectations of lower real interest rates, and expanding central bank purchases. Commodities are more sensitive to physical demand-and-supply shocks such as oil and copper, and play a role in supporting the downside of a portfolio.
Gold prices 2fell by 16% in just one quarter. Compared with the early-year peak, they are down by more than 7%. Seeing this, many people will think, “As expected, gold is risky,” and step away.
But Wall Street heavyweights are the opposite. Right now, they are saying to increase exposure to gold and commodities instead. If you read this article to the end, you will see that the reason is not “just because it is a safe-haven asset,” but a far more specific calculation. If you do not understand this trend, you will miss one of the most important defensive opportunities in the second half of the market.
Rates and the dollar pressured gold, but the direction is more complicated than you might think
Gold is an asset that does not pay interest. When rates are high, there is less reason to hold it. In fact, there was a period when gold’s rise was pressured as Treasury yields climbed and the dollar strengthened on Middle East-related risks. Goldman Sachs analysis also identifies higher real rates and a stronger dollar as the direct backdrop to gold’s recent decline.
Here is the reversal. JP Morgan said 2026year-end gold target price per ounce was 6,000dollars. 2027In 6,300it sees up to 6,200dollars. UBS went one step further, saying that there is room for gold to rise to that level on the basis of central bank demand, widening fiscal deficits, lower real rates, and geopolitical risks. The view is that gold is being pressured now not because it has lost its appeal, but because the dollar and rates variables are temporarily dominant.
The second-half scenario is not over yet
Looking at the World Gold Council’s second-half scenario, the story is still unfolding. If even one catalyst such as slower growth, a new geopolitical shock, a shift toward rate-cut expectations, or inflows from bargain hunting materializes, gold could rebound toward the 4,500dollar level per ounce again. On the other hand, if growth remains solid, interest rates rise, and the market stays calm, there could be further downside, but 10a drop of more than % is expected to be held back by bargain hunters.
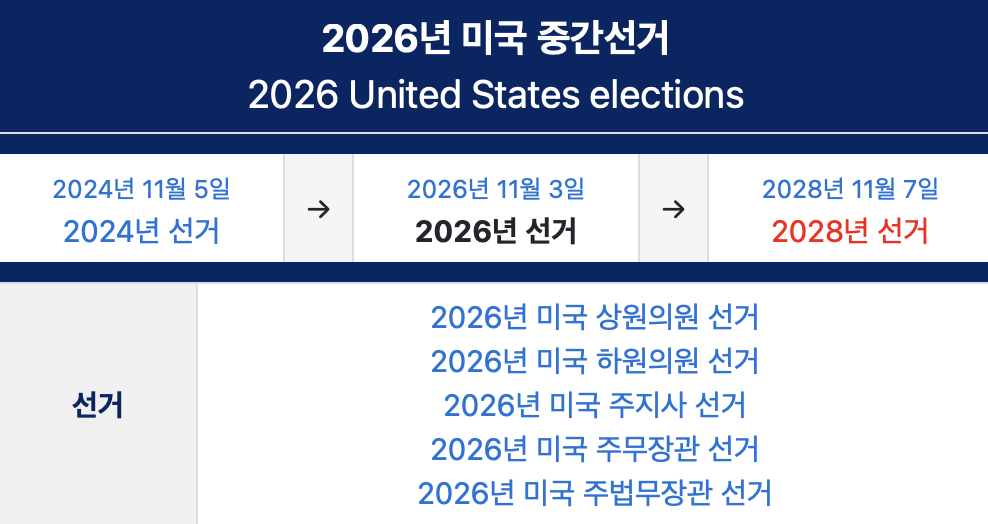
There is one more variable. 11the U.S. midterm elections. Democrats are expected to retake the House while Republicans keep the Senate. The correlation between election results and gold prices itself is not clear, but when Democrats gain momentum, demand for gold bars and coins from individual investors in the U.S. has tended to increase. It is a pattern in which hedge demand builds as political uncertainty rises.
The real key is the geopolitical risk premium
When unpredictable events such as war, tariff disputes, or supply chain shocks occur, gold is the asset investors rush into. Bonds or stocks often move together under such shocks, but gold moves relatively independently.
The World Gold Council said 2026that geopolitics remains the most central variable in its gold demand outlook for this year. It also expects inflation and high gold prices to provide additional investment momentum. An analysis also said the U.S.-Israel-Iran conflict is affecting even the movement in government bond yields and central bank policy judgments.
The figures confirm it as well. 1Quarterly gold demand rose 2percent year on year to 1,231tons. With the surge in prices, total demand value jumped 74percent to 1,930billion dollars, setting an all-time high.
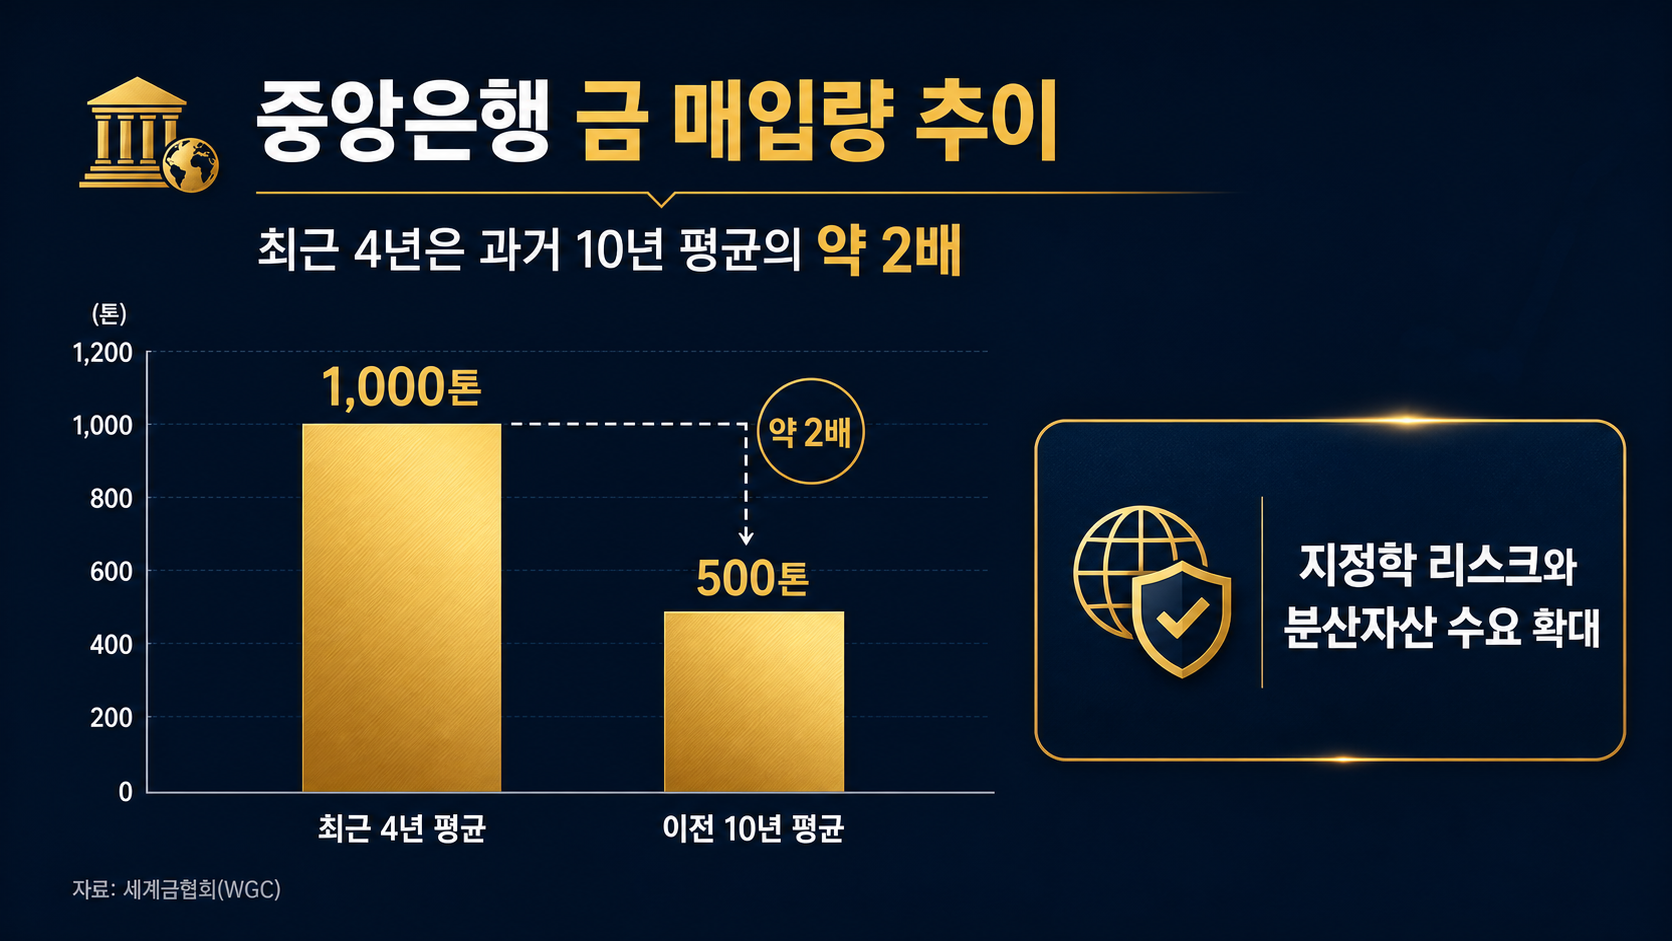
The movements of central banks are especially interesting. Over the past 4years, central banks bought an average of 1,000tons of gold per year. The average for the preceding 10years was 500tons, so that is twice the pace. In the 1quarter, Turkey sold 60tons, and with selling by some countries standing out, net buying on the official tally at one point plunged to 16tons.
However, in reality it is likely to be higher than that. Because there is no IMF reporting obligation, undisclosed purchases are substantial. Actual purchases estimated from London OTC market flows and Swiss refinery shipments came in at 208tons, up from 244tons in the previous quarter. Among the central banks that responded to the survey, 4out of 3said they would reduce the share of dollars in their foreign exchange reserves over the next 5years.
Separate from individual investors buying and selling gold, a structural trend in which countries are already saying they will not rely only on the dollar is under way.
Asia is shifting the center of gravity of gold demand
There is one more axis that is easy to miss. Demand from Asian individual investors. 1Quarterly demand for gold bars and coins rose by 42to 474tons, the second-highest on record, driven by Asian investors.
China is using gold as a portfolio hedge as its property and stock markets wobble. Recently, it also launched a pilot program allowing insurers to invest in gold up to 1of assets. In India, gold ETF assets grew 2020from the previous year by 15.5times, supported by structural factors such as rising incomes, an inflation hedge, a weaker rupee, and demand during wedding and festival seasons. As retail investors in the West pay less attention, Asia is shifting the center of gravity of gold demand.
Commodities are different from gold
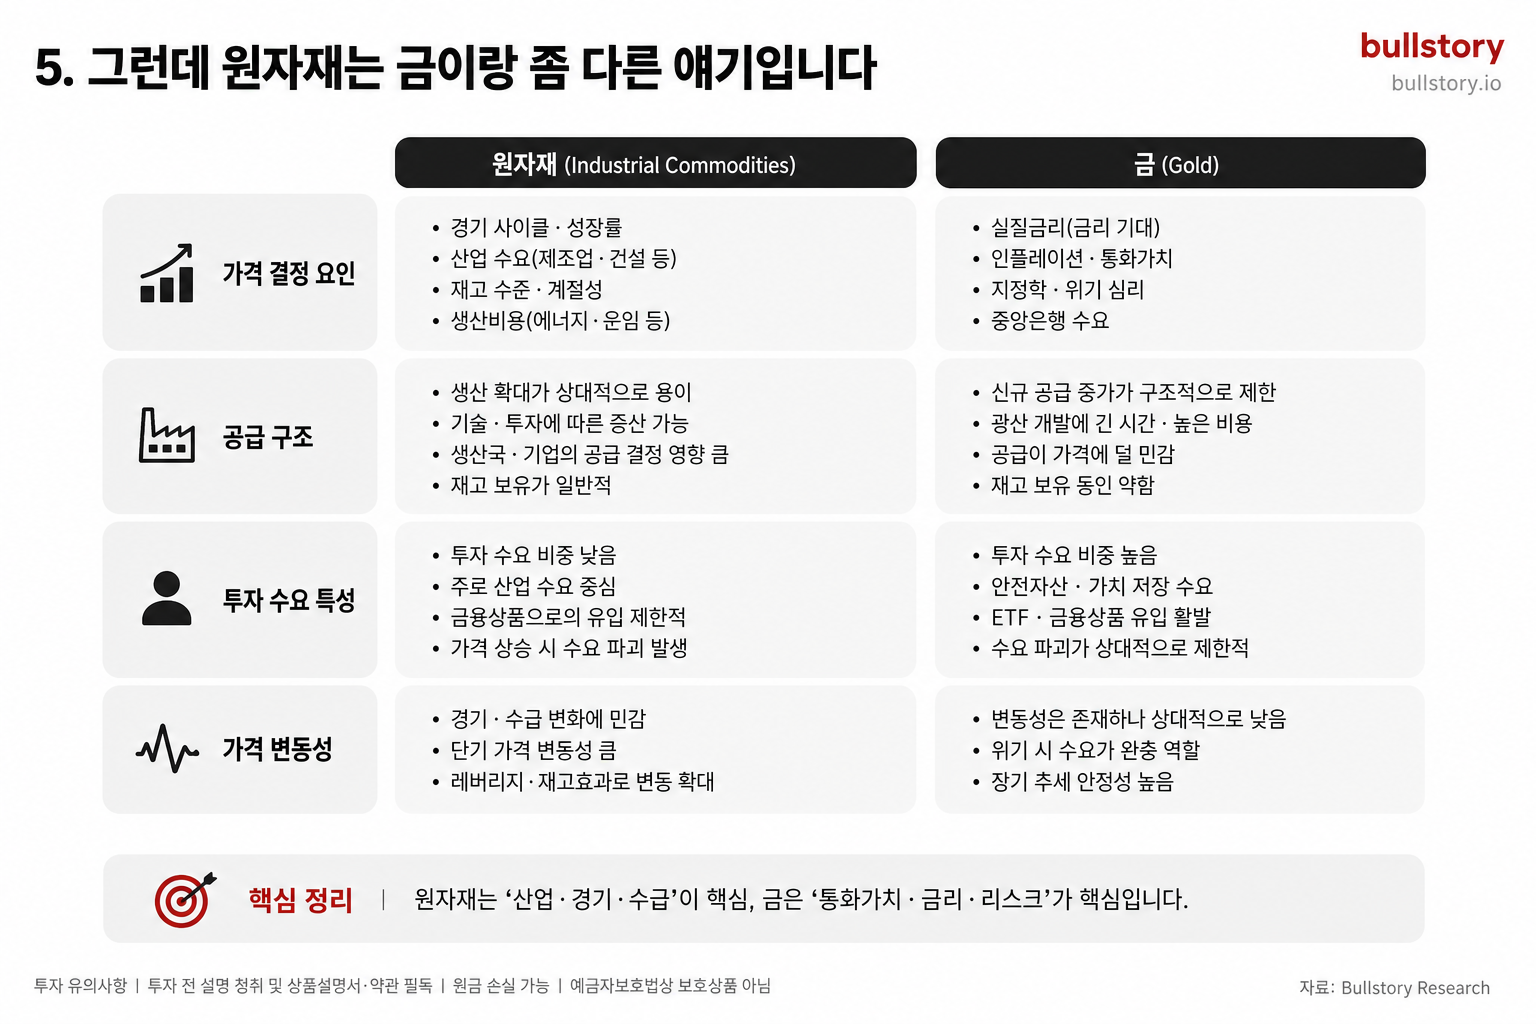
Gold and commodities should not be lumped together. Commodities (such as oil, copper, and agricultural products) respond more directly to real demand and supply shocks.
Morgan Stanley came up with an interesting calculation. 2From the point when the conflict in Iran broke out at the end of the month to 3the end of the month, a typical portfolio made up of stocks 60 and bonds 40 lost 3.6 But if commodities had been mixed in by just 5 there would instead have been a gain of nearly 1% over the same period. The commodity basket (oil, metals, agricultural products) rose by 13.5%.
5A small allocation of % really did separate losses from gains. Commodities overall this year are up about 15% from the start of the year, and the notable point is that industrial metals such as copper, which are in shortage, rose along with gold and oil.
There is a term worth knowing here: stagflation. It refers to a situation in which prices rise while economic growth slows. Usually, when prices rise, interest rates go up, making bonds less favorable, and when growth slows, stocks also become less favorable. This is the situation that creates the worst-case combination in which stocks and bonds fall at the same time. The key logic is that commodities can instead serve as a buffer at that time.
Inflation Is Popping Again
You can tell the answer from the numbers. 4The consumer price index (CPI) for 3.8% year over year was 2023in 5the hottest reading since 6.0% surging on the producer price index (PPI) released the next day. It was the biggest jump since 2022year 12month. Around the same time, the 30-year Treasury yield rose above 5%, and the 10-year yield also climbed to around 4.49%.
4The consumer price index (CPI) for 3.8%
With inflation surging again, commodities have been regarded as assets that stand out for portfolio diversification when inflation is high. Looking at Wellington Asset Management's regime-based correlation analysis, when inflation is low, bonds do a good job of defending against stock declines. But when inflation is high, that relationship reverses and the defensive power of bonds weakens instead. Their assessment is that right now is a hot regime in which both inflation and growth are coming in higher than expected.
How much, and how, should it be allocated?
Gold and commodities are not assets to hold in order to maximize returns. A typical strategic allocation is presented at around 1~5% of a balanced portfolio.
If narrowed to domestically listed products, it looks like this.
How to allocate to gold
- ACE KRX Gold Spot(411060), TIGER KRX Gold Spot: both are spot-type products that track the KRX gold spot index. Because they are not structured to hedge currency risk, the USD/KRW exchange-rate move is reflected as is. A weaker won is favorable, and a stronger won may make it harder to keep up with the rise in international gold prices. Although they track the same index, TIGER, as the later entrant, has set a lower fee, so it is priced that way.
- KODEX Gold Futures(H), TIGER Gold Futures(H): these track gold futures prices rather than physical gold, and they have currency hedging in place. This is a structure used when you want to exclude exchange-rate variables and be exposed only to the movement in gold prices. Their characteristics differ from the two spot-type products above.8.88.88.9.90.8.88.99.84.0.84.0.95.3.5.5.82.4.99.8.83.81.92.88.9.84.5.90.99.80.84.8.8.88.3.84.2.8.0.88.84.8.0.84.9.5-2026.
How to broaden into commodities
- KODEX Silver Futures(H), TIGER Gold and Silver Futures(H): when you want to hold silver as well as gold
- TIGER Physical Copper, KODEX Copper Futures(H): copper has a strong industrial-material character, so it is an asset that is useful to view together with AI infrastructure and power-grid investment, and with themes sensitive to the business cycle
- KODEX WTI Crude Oil Futures(H): when you want to look at energy prices and inflation hedging together
- Agricultural commodity ETFs: individual product names differ by asset manager, but access is also possible through domestically listed ETFs
UBS’s advice points in the same direction. If you have already invested heavily in gold, it is worth considering broadening diversification into other commodities such as copper, aluminum, and agricultural products. The point is not to go all in on gold, but to spread holdings across commodities as well.
In summary
Gold is supported by structural pillars such as geopolitical risk, central bank buying, and Asian retail demand centered on China and India. Commodities serve as a buffer when inflation spikes and stocks and bonds are both shaken at the same time. Neither is a main source of returns; they are closer to a safety belt that helps keep the portfolio from falling apart.
Wishing you successful investing.
Those who survive seize the next opportunity.
Frequently asked questions
2026What is the outlook for gold prices in
JPMorgan sets a year-end target of per ounce 6,000and UBS leaves room for 6,200dollars. Geopolitics and interest rates are the variables.
2027What is the outlook for gold prices for the year?
J.P. Morgan projects 2027an ounce for the year 6,300dollars. However, geopolitical conflict and changes in real interest rates will determine the outcome.
What is the reason for the surge in commodity prices?
Commodities are sensitive to demand and supply shocks. For the year so far, they have risen by nearly 15percent from the start of the year, and supply shortages in copper and oil are behind it.
What is expected to happen to gold prices going forward?
The World Gold Council says that if there is bargain buying, expectations of interest-rate cuts, or a geopolitical shock, it could rebound to around 4,500dollars per ounce.
How much raw materials should be put into a portfolio?
In Morgan Stanley’s case, a 5% allocation to raw materials could turn a portfolio from a loss into about a 1% gain under the same shock.
How do gold and raw materials respond during stagflation?
Stagflation is a situation in which prices rise while growth slows. At such times, if stocks and bonds weaken at the same time, gold and raw materials provide a defensive function.