Bullstory Research September 3, 2026
DIVO dividends: how much is received each month. Yield and ex-dividend date, a complete comparison of JEPI and SCHD
Key takeaways
DIVO’s most recent monthly dividend (record date 2026year 5month 28day) was 0.184dollars per share. The annualized dividend yield is 4.85percent, and the sum of dividends per share over the last 12months was 2.21dollars. Assets under management are about 71one hundred million dollars, which is smaller in scale than JEPI, whose assets under management are in the tens of billions of dollars.
DIVO dividend: how much does it pay now
DIVO (Amplify CWP Enhanced Dividend Income ETF) pays monthly dividends. [8%EA%B5%AD-%EC%9B%94%EB%B0%B0%EB%8B%B9-etf-%EC%B6%94%EC%B2%9C-5%EC%84%A0-%EB%B0%B0%EB%8B%B9%EB%A5%A0%EC%84%B8%EA%B8%88%EA%B3%84%EC%A2%8C-%EB%B0%B0%EC%B9%98-%EC%99%84%EC%A0%84-%EC%A0%95%EB%A6%AC-2026)
The most recently paid dividend was 2026 year 5 month 28 day, and the dividend per share was 0.184 dollars.
2026 year 6 month 29 day, the dividend yield was an annual 4.85%, and the trailing twelve-month dividend per share was 12 months, 2.21 dollars.
If you read this article to the end, the structure of DIVO dividends, how to calculate the ex-dividend date, and how it differs from JEPI and SCHD will all be summarized at once.

What is the dividend per share right now, specifically?
2026In 5 as of 28the ex-dividend date, the dividend paid was $0.184 per share.
The share price is around 45 dollars.
100 shares (about 630 ten-thousand won), and each month you receive about 2 ten-thousand 6,000won.
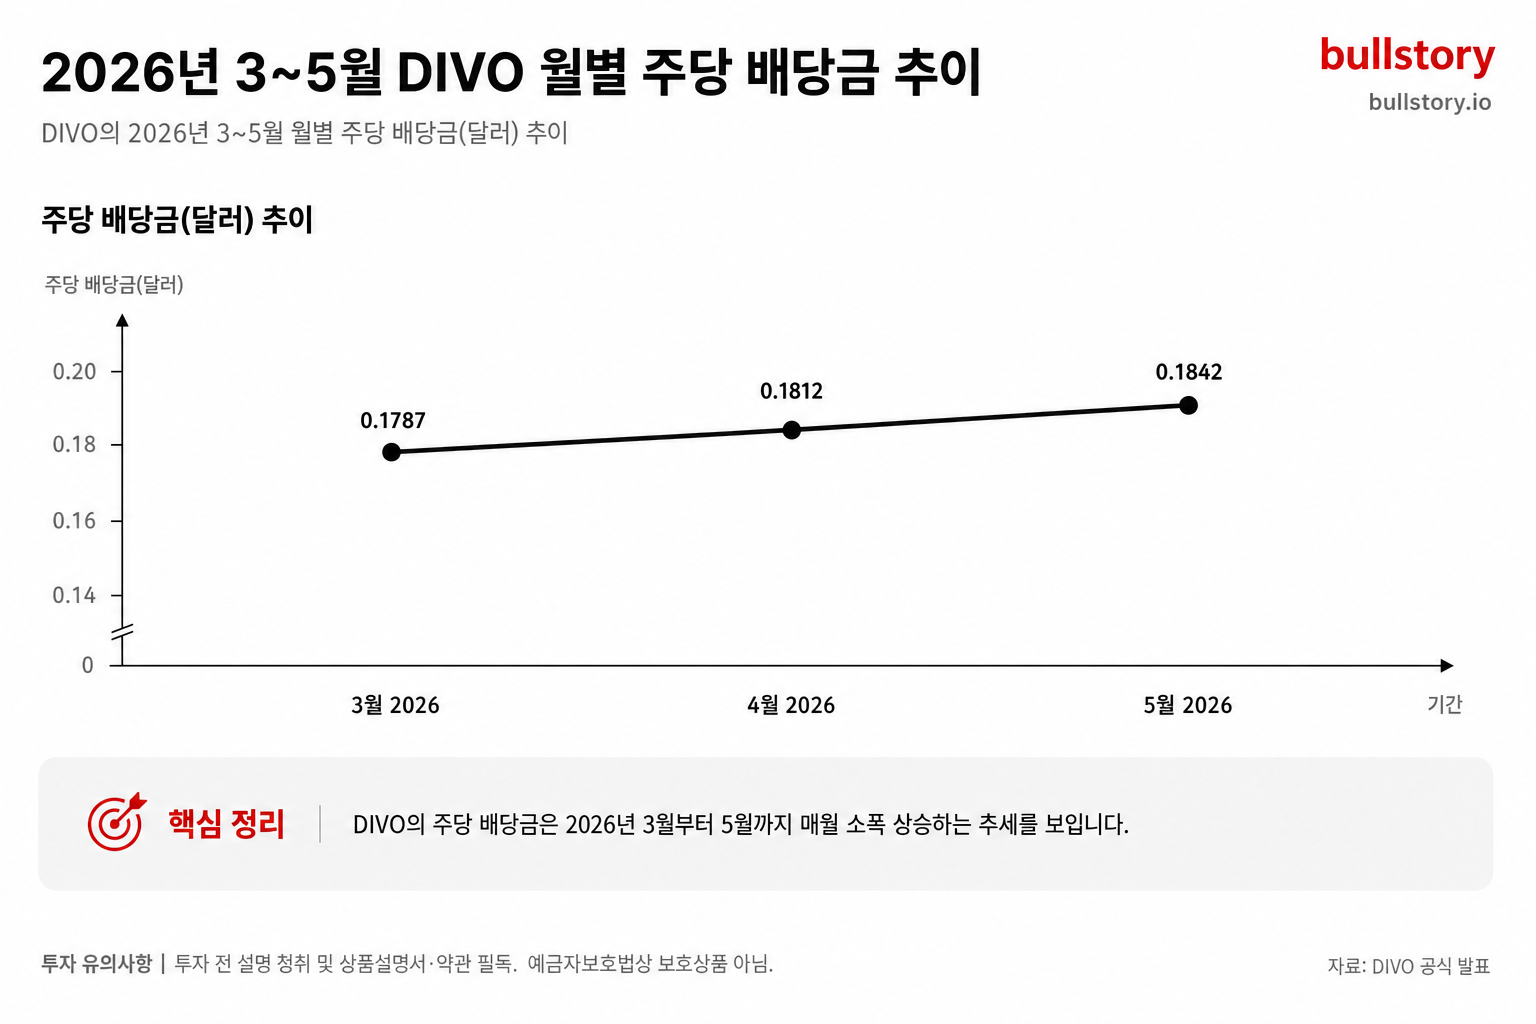
2026Breaking down the dividend flow for 3 the dividend in 0.1787 was $.
4In 0.1812 it was $5, and in 0.1842 it rose slightly to $
You should know in advance that the monthly amount is not fixed. Dividend income from the holdings and option premiums (fees received when selling, like insurance premiums) are mixed together, so the dividend amount changes depending on market conditions.
How high is the dividend yield?
As of 2026year 6month 29day, DIVO's dividend yield is 4.85% annually. Dividend yield is the ratio of dividends to share price, 1based on the dividend amount for 100won invested, it shows how much dividend you receive in 1year.
In the U.S. 10year Treasury yields in the 4% range environment, this yield provides more cash flow than bonds. Rather than holding only bonds, you can receive dividends and also expect the possibility of share price gains.
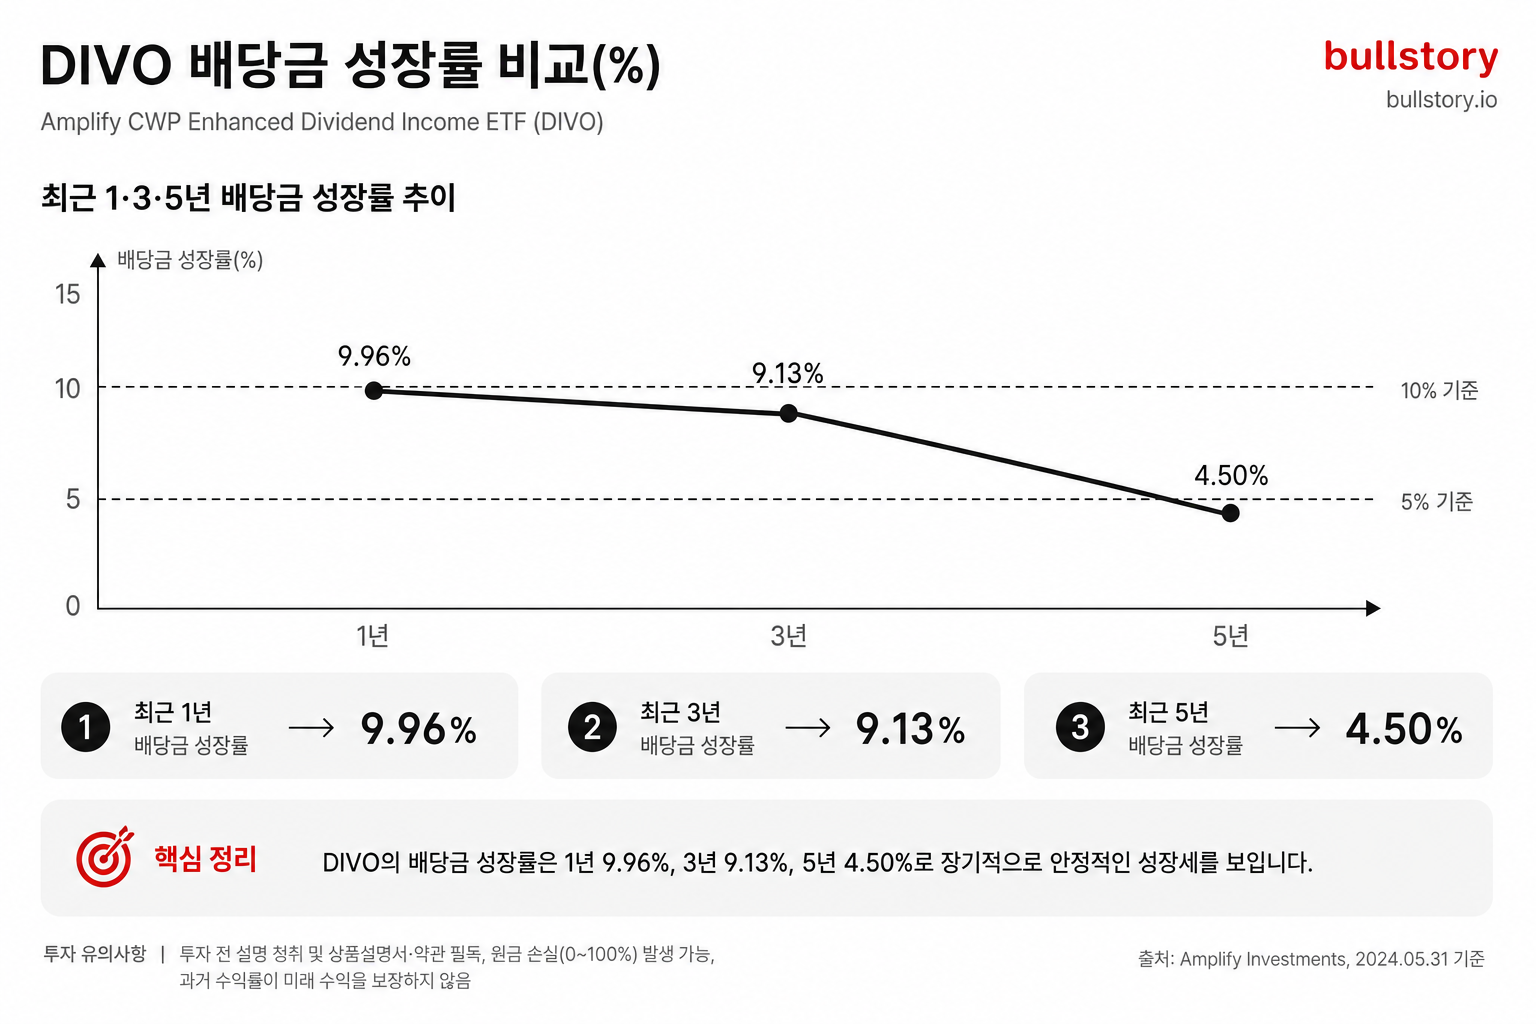
Dividend growth rates are summarized in the table below.
| Period | Growth Rate |
|---|---|
| Recent 1years | 9.96% |
| Average over 3years | 9.13% |
| Average over 5years | 4.50% |
5The long-term average over the years is fairly reasonable. However, the point is that the recent 1~3year growth pace is faster.
When is the ex-dividend date?
The ex-dividend date is the reference date after which if you buy the stock, you will not receive that month’s dividend. To receive the dividend, you must buy the stock by the day before the ex-dividend date.
DIVO pays dividends every month, and the most recent ex-dividend date was 2026year 5month 28day.
Usually, the ex-dividend date is set near the end of each month (27~30day), and payment is made on the next business day or at month-end.
The next ex-dividend date is expected to be 8month 21day through 9month 1day.
The ex-dividend and payment-date schedule is announced monthly based on Amplify ETFs’ official disclosures. When timing trades, check the official disclosures directly.
DIVO dividend key figures at a glance
| Item | Figure |
|---|---|
| Most recent monthly dividend (2026 year 5 month) | per share 0.184 dollars |
| Annual dividend yield | 4.85% (2026 year 6 month 29 day as of) |
| [Management fee](management fee) | 9% |
| Assets under management | about 4 hundred million dollars |
| Dividend payment frequency | monthly |
| Most recent ex-dividend date | 9 year 9 month 3 day |
| Am88plify ETFs official disclosure link | direct check required |
| Note | direct review before trade timing |
| Institutional liquidity | sufficient for trading by institutional investors |
| Comparison with JEPI | JEPI’s assets under management are in the tens of billions of dollars, so the scale difference is clear |
| Most recent ex-dividend date listed | 5 year 28 month |
(Source: Dividend.com as of 2026 year 6 month 29 day)
Assets under management are about 71 hundred million dollars. It has enough liquidity for institutional investors to trade. However, compared with JEPI’s assets under management, which are in the tens of billions of dollars, the scale difference is clear.
This is where this dividend comes from, and that is the key to this ETF. The next section, "Why DIVO Can Pay Monthly Dividends," explains in detail the structure of the two revenue streams: dividend income from dividend stocks and an options strategy.
Why DIVO Can Pay Monthly Dividends
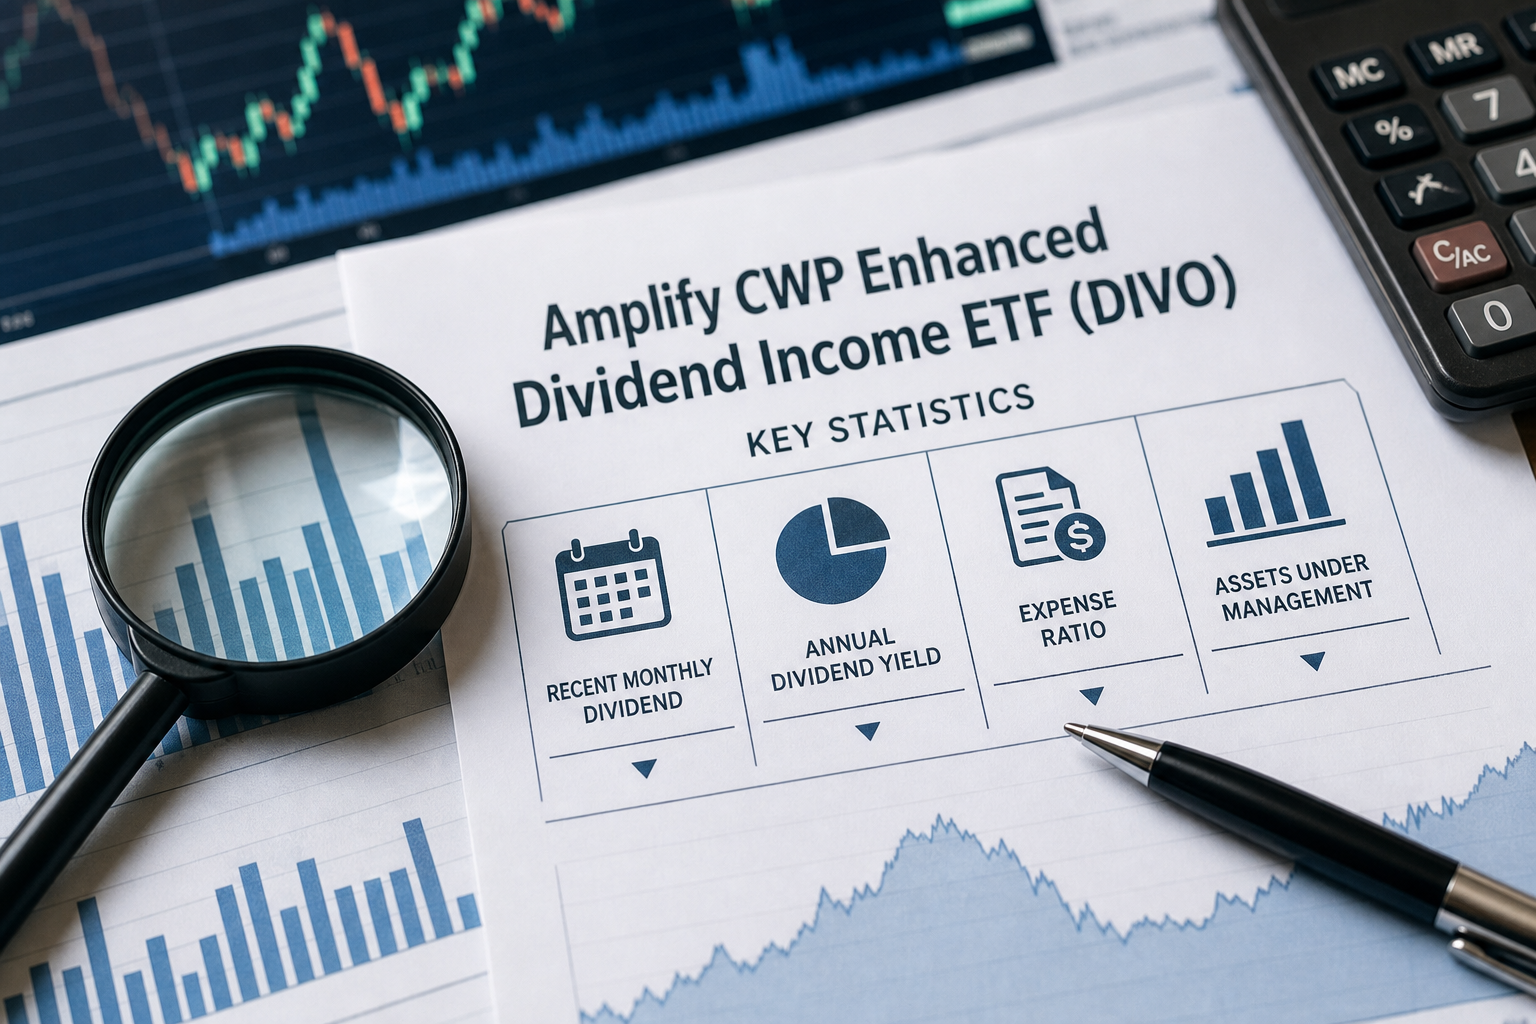
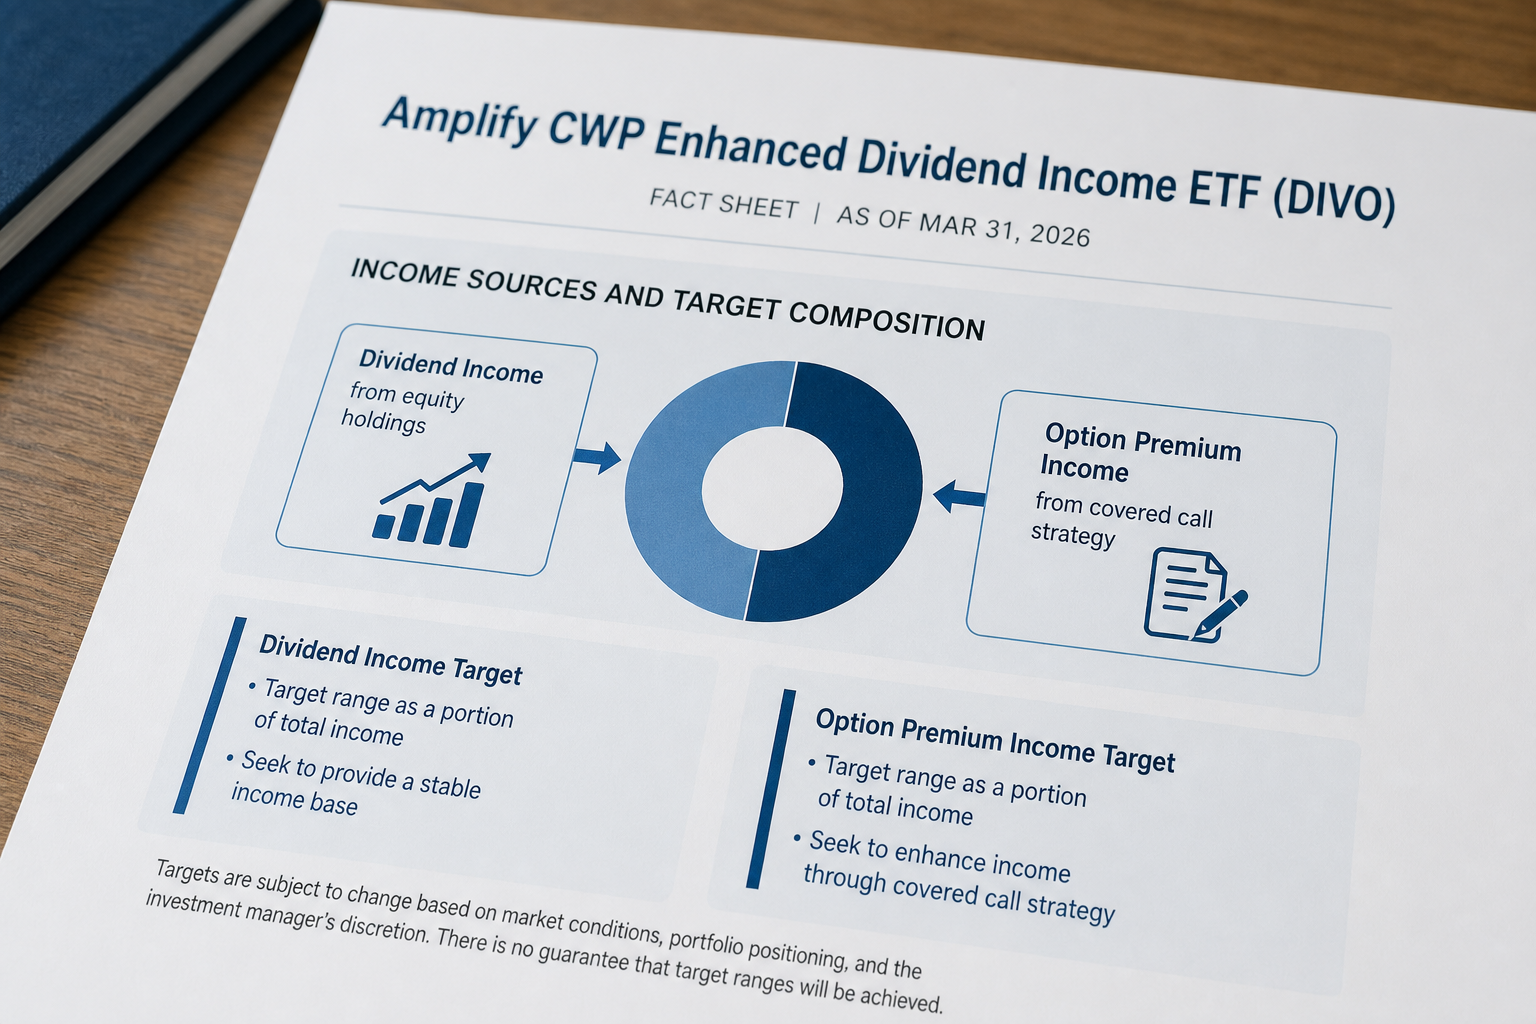
The reason DIVO’s dividends come in every month without fail is that it has two sources of income. One is the dividends received from dividend stocks, and the other is the option premium earned by selling covered calls on those stocks.
According to the Amplify ETFs fact sheet (2026year 3month 31day as of), DIVO targets about 2~3% of annual dividends.
The option premium targets about 2~4%, and in total it seeks cash flow in the annual 4~7% range.
Income source ①: Dividends from dividend stocks
DIVO holds blue-chip large-cap stocks with a record of dividends and profit growth 20~25 companies. It looks at fundamental indicators such as market capitalization and management performance. It also checks earnings, cash flow, and return on equity.
This means it includes only leading U.S. companies that have steadily raised dividends over a long period of time. When these companies pay dividends every quarter, DIVO collects them and distributes them to investors each month. In effect, dividend stock investing is the raw material.
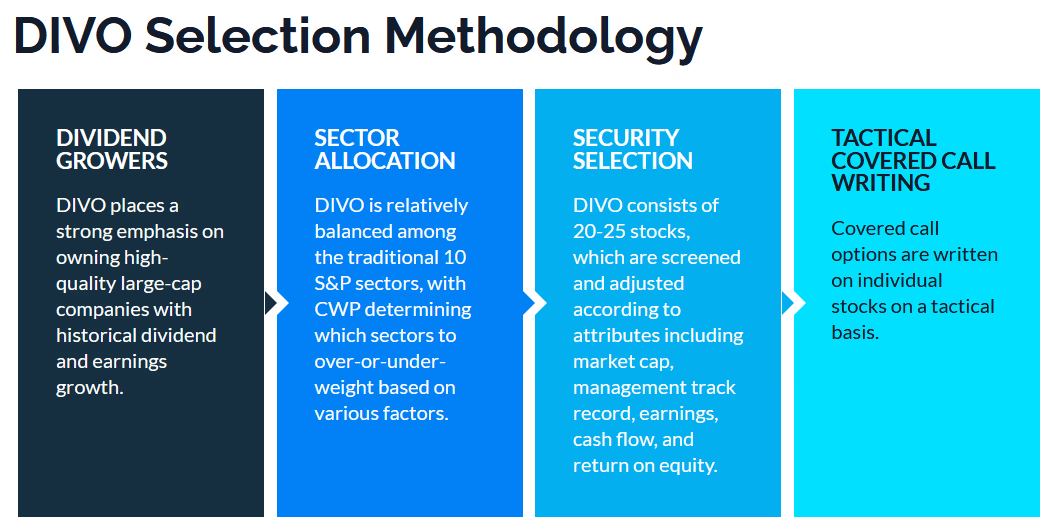
Income source ②: option premium received through a covered call
A covered call (Covered Call) is a method in which, for stock I already hold, I sell [the right to buy at a set price to the3buyer](4In2s84id93e9 C9ov9er-3e6d84C7a8l97l90-0e9t8f80-1p9r9o4d95u4c95t98-8g94u5i1d0e99-etf-80c88o9v90e3r9e98d0c90) in exchange for cash (premium). If the stock price rises above that price, I give up the excess return in exchange for receiving cash now.
DIVO earns premium income when selling covered calls by giving up any rise above the stock’s specified strike price.
Other covered call ETFs often mechanically write covered calls on all holdings. DIVO does not.
DIVO’s choice: selectively, not on everything
The manager, Capital Wealth Planning (CWP), does not obligatorily write covered calls on every holding. When a particular stock shows strength or 82i4m9p3l80i8e99d 84v1o
The proportion of DIVO to which covered calls are applied moves flexibly at about 7~20% of the entire portfolio. This approach complements returns with premium income without blocking the portfolio’s upside outright.
Summarizing this structure, it is as follows.
| Category | Method | Features |
|---|---|---|
| Standard covered call ETF | Mechanically sells call options across all holdings | Returns are steady, but upside is heavily capped |
| DIVO | Strategically sells call options on selected holdings | Supplements premium income while preserving upside potential |
So are there no drawbacks?
In a rising market, DIVO follows only about 75~85% of the stock price gains. That is because it gives up any further upside on the positions sold through covered calls.
When market volatility declines, option premiums shrink, so dividend income may become less stable. That is because part of the dividends comes from premiums that vary depending on stock price conditions.
DIVO's monthly dividend is stable when both income sources work together. Dividend-paying stocks provide dividends, and selective covered calls add cash on top. Neither side alone produces the current yield.
You can see which stocks this portfolio is actually made up of in the next section, "What Does the DIVO Portfolio Look Like?"
What Does the DIVO Portfolio Look Like?
DIVO is 20~25a concentrated portfolio that holds only stocks.
Compared with the 500S&P 500stocks it holds, you can get a sense of just how narrowly it screens.
Among the top holdings are IBM and Microsoft. American Express, Caterpillar, and JPMorgan Chase are also included. Each company accounts for about 5% of the portfolio.
With so few stocks, each one carries considerable weight. That is the starting point for understanding DIVO.
What are the stock selection criteria?
CWP, the asset manager, looks for500 high-quality large-cap stocks within the S&P that are likely to sustain profits and cash flow over the long term. It prioritizes companies with a history of steadily increasing dividends.
It looks at market capitalization, management performance, earnings, and cash flow. Return on equity (ROE) is an indicator that shows how much profit a company generates with shareholders' money. Based on these items, it screens stocks and adjusts weights.
This means it is not simply about buying stocks with high dividends. It first looks for companies with the strength to raise dividends over a long period, steadily.
Where and how much to allocate by sector
2025As of 9 DIVO is most exposed to the financial, industrials, and information technology sectors. The breakdown makes it clearer.30.
The financial sector accounts for 22.11%, and the technology sector for 21.89%, making them the top two sectors.
| Sector | Example major holdings |
|---|---|
| Financials | JPMorgan Chase, American Express, Goldman Sachs |
| Technology | Microsoft, Apple |
| Industrials | Caterpillar |
| Consumer Staples·Healthcare | Johnson & Johnson, Home Depot, McDonald’s |
(Based on disclosures from Amplify ETFs and data from stockanalysis.com)
Sector weights are not fixed. They change according to CWP’s macroeconomic outlook. At present, compared with the S&P 500 it holds more Financials and Industrials. This means the manager adjusts the weights by watching market trends rather than simply copying the index.
What is an active ETF, and why does DIVO matter?
An active ETF is a product in which the fund manager directly selects holdings and adjusts their weights. A passive ETF simply tracks an index. The management style is different.
DIVO uses a true active strategy. It actively manages not only stock selection but also options. It does not mechanically use covered calls every month under fixed rules. It adjusts by hand to market conditions.
This active approach is evident in its covered-call management style. Instead of writing options on the entire portfolio or the entire index, it selectively writes them on individual stocks. It first looks at volatility and the share-price level. It then examines nearby events or technical support levels. It uses those factors together to decide whether to use options. The strike price and expiration are also set differently each time.
The options strategy is more selective than systematic. In a rising market, if option premiums are not attractive, it may use almost no contracts. In a period of high volatility, by contrast, it writes more.
JEPI or QYLD (QYLD, an ETF that writes covered calls on the entire Nasdaq 100 index every month) mechanically sells call options every month regardless of market conditions. This method produces higher returns, but volatility is also greater.
DIVO is structured to combine dividend income of about 2% and option premium of about 2.5%. With this combined approach, it aims for a more stable monthly dividend while targeting an annual return in the 4 to 5% range.
What is the management fee, and is it expensive?
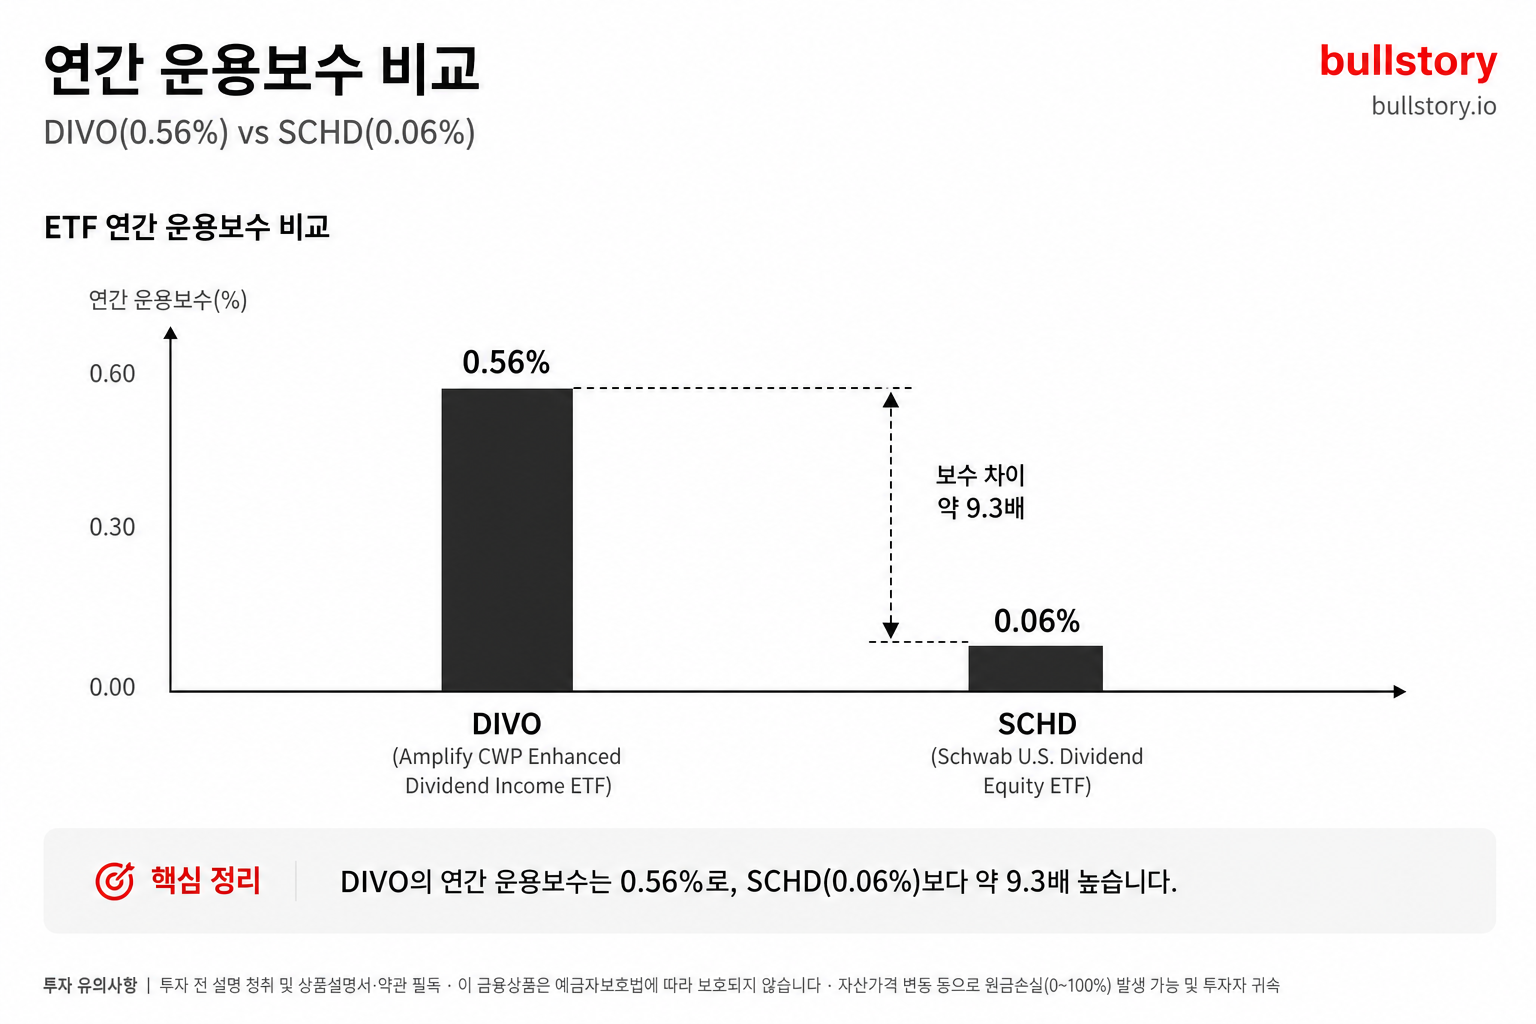
DIVO's management fee is 0.55% per year.
1,000Investing ten thousand won means paying 55,000won in fees over one year.
The management fee for passive dividend ETFs such as SCHD and VYM is 0.06~0.08%.7~9times more expensive for DIVO. The cost of the manager directly handling everything from stock selection to options management is reflected in this difference.
Whether it is expensive or not is ultimately judged by whether it delivers performance equal to that difference. Check the figure directly in the next section, "2025report card".
2025report card: How has DIVO performed so far?
DIVO’s 2025annual total return (price gain + dividends combined) was <strong>17.41%</strong>. The category average for the same year was 10.47%, so it was ahead by about 7percentage points.
Based on Yahoo Finance performance data, DIVO’s 2016listing in 12annualized total return since listing is 12.63%. The cumulative nominal total return since listing has reached 205.03%.
Total return by year 9full-year record
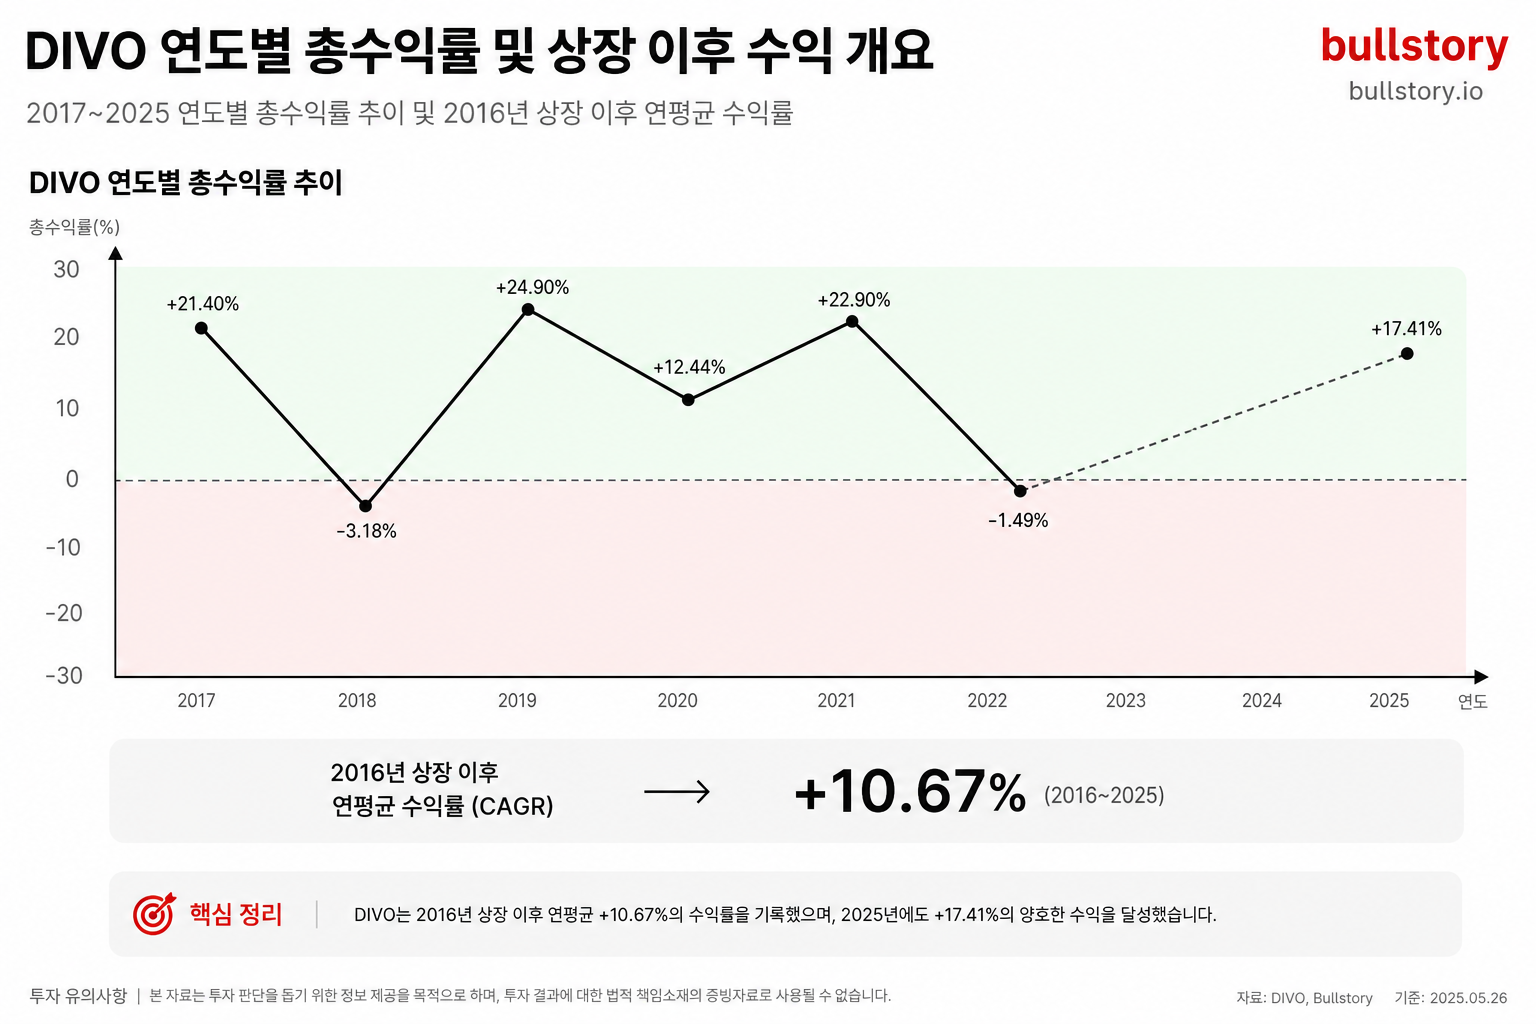
According to Yahoo Finance performance history, the annual total returns of DIVO since its listing are as follows.
| Year | DIVO Total Return | Category Average |
|---|---|---|
| 2017 | +21.40% | +13.46% |
| 2018 | -3.18% | -5.81% |
| 2019 | +24.90% | +18.81% |
| 2020 | +12.44% | +4.24% |
| 2021 | +22.90% | +18.21% |
| 2022 | -1.49% | -10.23% |
| 2023 | +6.96% | +14.97% |
| 2024 | +16.22% | +17.59% |
| 2025 | +17.41% | +10.47% |
9In some of those 7years, it outperformed the category average.
2023The 2024 and the following period were bull markets centered on large-cap tech stocks. Because of DIVO's concentrated holdings structure, it was somewhat held back in this period.
2022The year in question was the real test for this ETF
When choosing a covered call ETF, the first number to check is not the yield, but how well it held up in a down market.
2022In the year S&P 500fell by 18the category average fell by 10.
DIVO posted only 1.5in losses. In years when JEPI and XYLD, also in the covered call family, recorded losses from low single digits to double digits, DIVO essentially finished the year flat.
The secret is that it uses covered calls selectively, not across the entire portfolio. DIVO writes covered calls only on individual holdings, and applies them to only 20to 25percent of the portfolio at a time. The rest is simply held as stocks. When prices rise, it can choose not to write covered calls on that holding. In a down market, the defensive strength of the dividend stocks themselves kicks in, and because the covered call share is low, the stocks are less constrained even when they rise.
How was it different from other covered call ETFs in rising markets
The structural weakness of covered call ETFs is in a rising market. In exchange for collecting option premiums, they must give up any excess gains once the stock price rises above a certain level. In a structure like JEPI, which systematically writes covered calls across the S&P500 universe, this drag shows up even more clearly.
DIVO leaves more room for upside participation through a selective covered call strategy. JEPI uses a systematic call-selling approach, which leaves a lot of upside capped.
For example, 2021a year with 22.90percent and 2025a year with 17.41percent can be seen as a strong year. 2024a year with 16.22percent is the same kind of case. Numbers like these make it look more like a growth ETF than an income ETF.
5Looking at the cumulative result over a year, the gap becomes even clearer.
Over the most recent 5 years, JEPI recorded an annual average of 7.33percent, while DIVO recorded 10.73percent.
The difference in returns is 3.4percentage points. If that difference compounds over 10years, it creates a noticeable gap in the final balance relative to the original principal.
There are drawbacks too: 2023~2024 year's rebound
To be fair, DIVO did not always win.
2023DIVO's total return in the year was 6.96%, and the category average was 14.97%.
2024In the year, DIVO was 16.22% behind the category average of 17.59%.
These two years were a period when AI growth stocks led by NVIDIA pulled the market higher. A value portfolio centered on dividend stocks like DIVO could not help but be relatively disadvantaged in this period.
DIVO shines in down markets and in modest uptrends. In a market where a specific sector surges, as with the AI theme, it may lag behind an S&P 500 index-tracking ETF.
A direct comparison of the three ETFs, DIVO, JEPI, and SCHD, covering return, volatility, and MDD 5 can be found in the next section.
DIVO, JEPI, SCHD compared directly in numbers
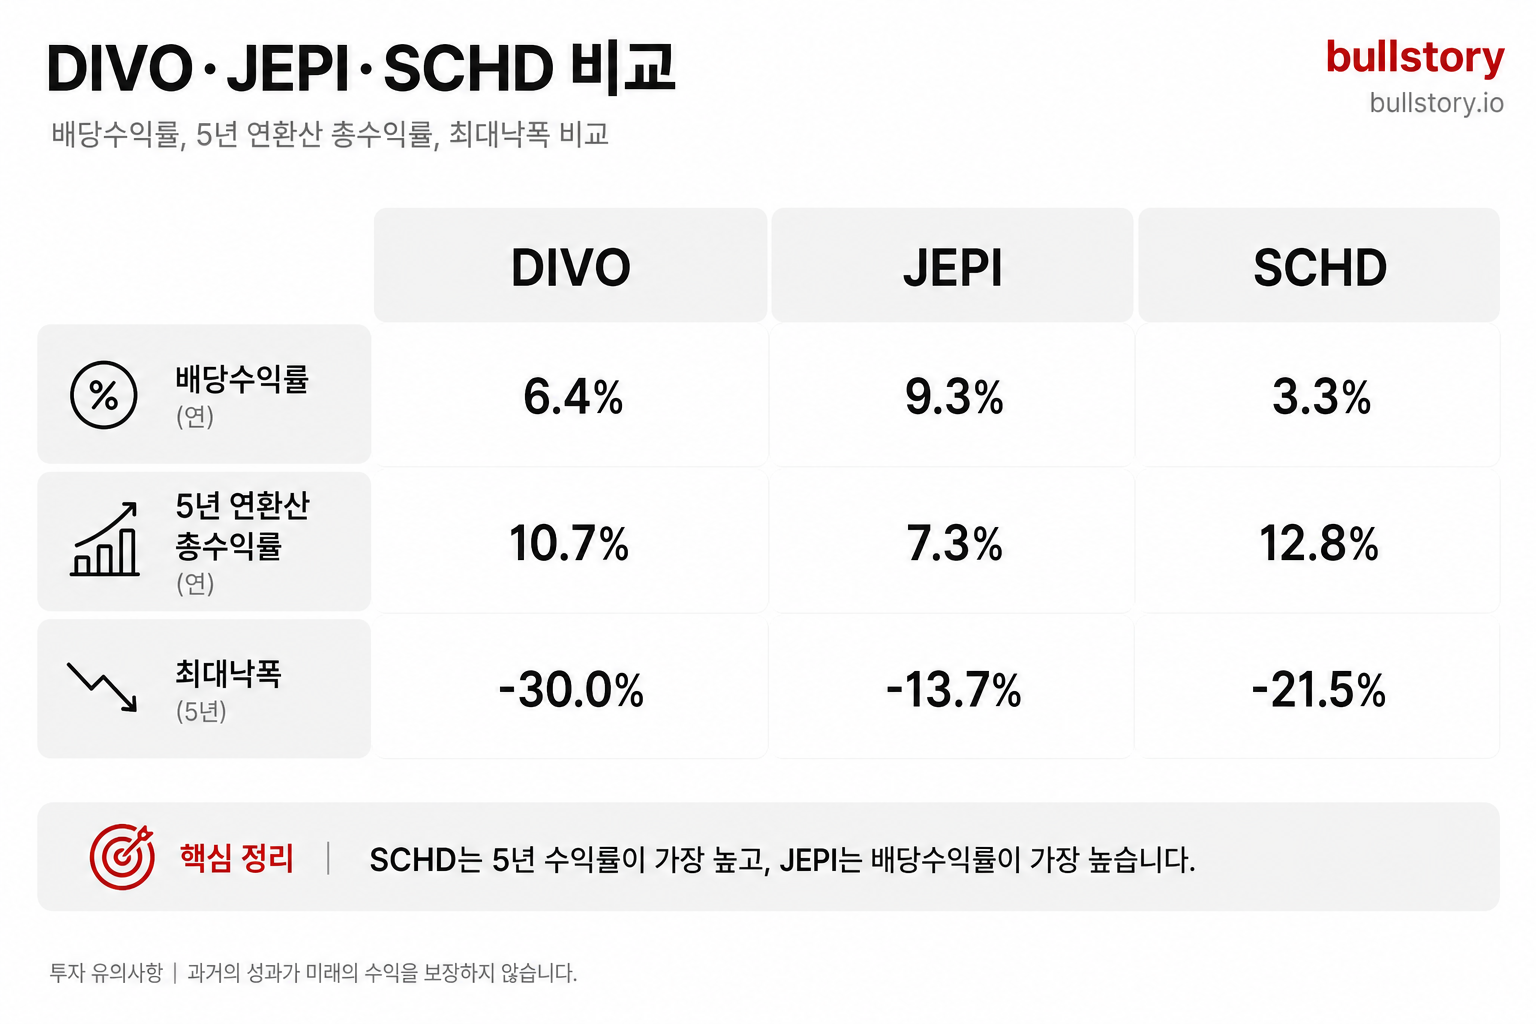
Of the three ETFs, the one that can pay out the most dividends right now is JEPI. JEPI’s recent 12-month dividend yield (the ratio of share price to 1-year dividend amount) is about 9.26%. DIVO is 4.85%.
SCHD’s dividend yield is about 3.27%, the lowest of the three. However, SCHD is a fund that has increased its dividend for 14consecutive years](/blog/%EB%B0%0%EB%8B%B9-etf-%EC%99%84%EC%A0%84-%EC%A0%95%EB%B3%B5-schdjepqjepi-%EB%B0%B0%EB%8B%B9%EB%A5%A0%EB%B0%B0%EB%8B%B9%EA%B8%88-%EC%8B%A4%EC%A0%84-%EB%B9%84%EA%B5%90-2026) fund. Looking only at the numbers, you might think, "Isn’t JEPI the best?" But the real comparison starts here.
5Key comparison table for a few items
The table below is organized based on public data from PortfoliosLab, ETF.com, Yahoo Finance, and others.
| Item | DIVO | JEPI | SCHD |
|---|---|---|---|
| Dividend yield | about 4.9% | about 9.3% | about 3.3% |
| 5-year annualized total return | about 10.7% | about 7.3% | about 12.8% |
| MDD (maximum drawdown) | -30.0% | -13.7% | -21.5% |
| Expense ratio | 0.56% | 0.35% | 0.06% |
| Dividend payment frequency | monthly | monthly | quarterly |
| Management style | active | active | passive |
MDD (maximum drawdown, the proportion of the drop from peak to trough) is a number that intuitively shows how much my account fell on the worst day.
Dividend yield: JEPI’s 9% really that good?
JEPI’s dividends mainly come from option premiums, that is, the money earned by selling covered calls. A covered call is a structure in which you receive cash up front in exchange for giving up some of the upside when the stock price rises sharply.
The issue arises when the market rises sharply. In a period of surging stock prices, JEPI does not fully participate in the upside because of its options strategy. In fact, looking at the recent 1-year returns, JEPI was at 7.90%, while DIVO was at 19.46%.
DIVO combines dividend-stock investing with covered calls, but uses covered calls only selectively, leaving some room to capture stock-price gains. This difference is why DIVO's total return has outperformed JEPI in bull markets.
Total return: 10Who wins if you hold it for years
5The 10.73-year total return (including dividend reinvestment) was DIVO at annual 7.33%, and JEPI at annual %.
Over the past 10years, SCHD's average annual return was 12.84%, making it the highest long-term total return among the three ETFs.
The pace of dividend growth is also different. SCHD's dividends increased at an average annual rate of 10 to 10 percent over the past 12 years. For example, if you bought SCHD 10 years ago at a dividend yield of 3 percent, it means you are now receiving a dividend of more than 7 percent on your original principal.
By contrast, JEPI shows a different pattern. JEPI's annualized dividend growth rate (CAGR) is about -1.31 percent. In other words, even if the dividend is high now, it tends to decline over time.
MDD and volatility: how much can it hold up in a sharp sell-off
The all-time maximum drawdown for JEPI was -13.71 percent. DIVO's was -30.04 percent, a large difference. Because of its option strategy, JEPI has relatively stronger defense in down markets. DIVO has a larger stock allocation, so it falls together with the market when the market breaks down.
SCHD is not immune in a sharp sell-off either. As of 2026 year 6 month, SCHD's maximum drawdown was -21.54 percent, and it took 8 months to recover.
Monthly volatility is JEPI at 1.41%, DIVO at 2.24%. Lower volatility means it falls less when the market drops, but it also rises less when the market goes up. For someone who does not want to lose money, JEPI is the right fit. This is why DIVO or SCHD is a better fit for someone aiming for long-term total returns.
Expense ratio: annual 0.06% vs 0.56% — 10how much difference after years?
JEPI’s expense ratio is 0.35%, and DIVO’s is 0.56%.
SCHD is 0.06%, the lowest of the three.
For example, 1,000won 10years, assuming you hold it for 50won more than SCHD.
However, DIVO and JEPI are active ETFs. Because the fund manager selects the stocks, they have higher fees, but unlike simply tracking an index, they are managed at the manager’s discretion.
Which investor is suited to what
- JEPI: For people who need monthly cash flow right now the most. However, they do not participate much in stock price gains.
- DIVO: For people who want monthly dividends while also expecting some stock price appreciation. The dividend is smaller than JEPI’s, but in a strong market the total return can sometimes be higher.
- SCHD: For people who are okay with having little dividend income now,10and who aim for dividends to grow in the years ahead. Its low management fee makes it suitable for long-term holding.
The three are not mutually exclusive choices. Depending on how you combine them, you can capture both monthly cash flow and long-term growth. That combination method is covered in detail in the 'Practical Portfolio' section.
Tax treatment also differs depending on whether the dividend comes from stock dividends or from option premiums. How this difference affects the amount received by Korean investors is summarized in the next section, 'Where Do Dividends Come From: Dividend Income vs. Option Premium Mix'.
Where dividends come from: dividend income vs. option premium mix
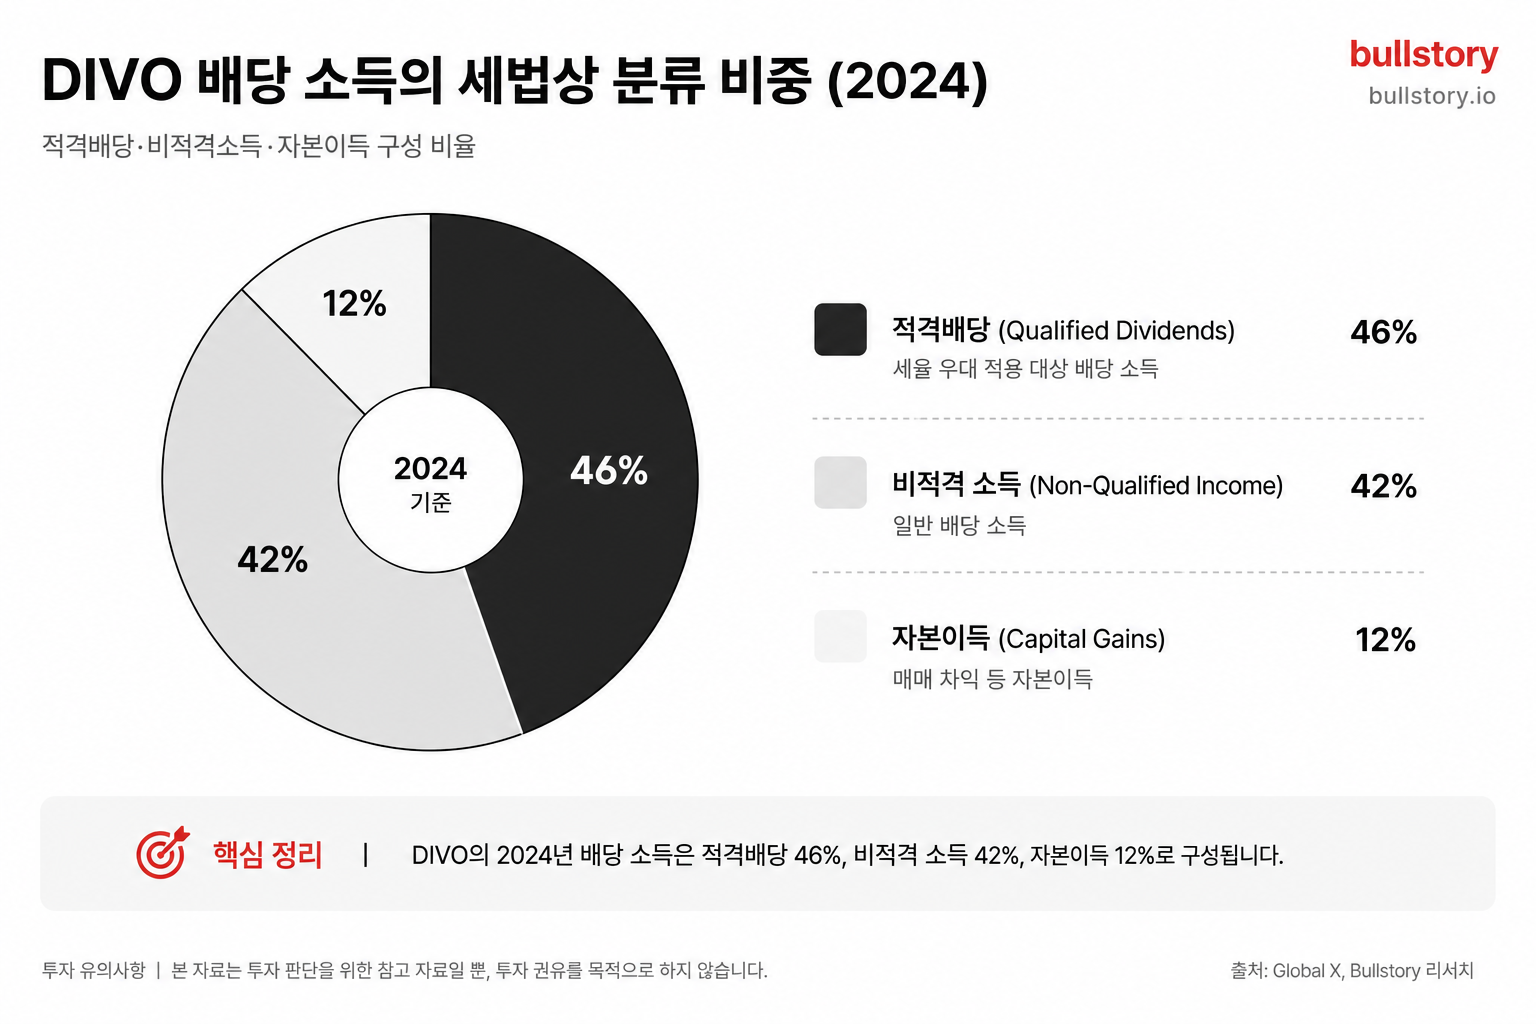
DIVO’s dividend comes from two places. One is the dividends received from the dividend stocks it holds. The other is the option premium received by writing covered calls on the stocks it holds.
The mix of these two income sources has a direct effect on taxes. 2024As of the year, about 46percent of total dividends are qualified dividends and 42percent is nonqualified income.
The remaining 12percent is classified as capital gains.
How income sources change taxes
The reason income classification matters in the United States is that Korean investors do not simply pay the tax withheld in the United States as is.
Qualified Dividend is a dividend paid on stocks held long term in the United States. The high-quality dividend stocks held in the DIVO portfolio fall into this category. By contrast, income from option premiums is classified as Non-Qualified Income. Under U.S. tax law, the tax rates applied to these two items are different. From the perspective of Korean investors, the final tax outcome is more important.
JEPI, which uses a covered call strategy similar to DIVO, has a much higher share of option premiums. For ETFs such as JEPI and XYLD, most of the dividends are classified as ordinary income, while DIVO has a structure that is favorable from a tax perspective because it has a high share of qualified dividends. The specific comparison figures can be found in the section titled 'DIVO vs JEPI vs SCHD, a direct comparison by the numbers'.
ROC, not something received but something returned
There is one more item to know. ROC (Return of Capital) is a dividend classification in which capital is returned, rather than being generated from investment income. Put simply, it is a case where an ETF takes out part of investors' money and pays it out when monthly profits appear to be insufficient.
2022In a downturn like the one in 50 years, as much as fifty percent of DIVO’s distribution was once classified as ROC. ROC is not taxed immediately. Instead, it lowers my purchase price (cost basis), and later, when I sell the shares, tax is levied on the gain calculated using that lower cost basis. The difference is whether you pay tax now or later.
For Korean investors: how much is actually withheld
DIVO is a foreign-listed ETF listed in U.S. dollars on the NYSE in the United States. Under Korean tax law, distributions from foreign-listed ETFs are treated the same as dividends from overseas stocks.
A dividend income tax of 15.4 percent, including local income tax, is withheld from distributions of foreign-listed ETFs. In the United States, withholding is also applied first.
The U.S. dividend withholding tax rate is 15 percent, higher than Korea’s dividend income tax rate of 14 percent. If 15 percent has already been paid in the United States, there is no additional tax to pay in Korea. In the end, the effective tax burden for a Korean investor on DIVO distributions is about 15 percent, based on U.S. withholding.
However, the amount classified as ROC is different. If some dividends are reclassified as ROC during the year-end tax settlement process, the local withholding tax may be refunded. In that case, additional tax may have to be paid in Korea. In many cases, the securities firm handles the actual settlement.
Comprehensive taxation on financial income, do I fall under it?
When financial income, including DIVO dividends and interest and dividends, is totaled on an annual basis, 2,000if it exceeds the threshold amount, the taxation method changes.
Annual financial income 2,000up to the threshold amount is 15.4withholding tax, including local income tax, and that settles the matter. 2,000If it exceeds the threshold amount, 6.6it becomes subject to comprehensive taxation at a progressive tax rate of 49.5to
Progressive tax is calculated by combining it with earned income, business income, and more. If a high-income employee puts a large amount of money into DIVO, the tax rate can rise sharply. If you become subject to comprehensive taxation on financial income, you cannot open an ISA, and health insurance premiums may also go up.
| Annual combined financial income | Taxation method | Effective tax rate |
|---|---|---|
| 2,000ten million won or less | Withholding tax settles the matter | 15.4% |
| 2,000more than ten million won | Comprehensive taxation (progressive) | 6.6%~49.5% |
2,000You may wonder how realistic the ten million won threshold is.
For example, if DIVO’s yield is viewed as roughly 5% , then when the principal is about 4one hundred million won, dividends alone come to 2,000ten million won. If you add bank deposit interest or distributions from other dividend ETFs, it becomes easier to exceed the threshold.
What changes if you use a tax-saving account
Overseas-listed ETFs cannot be purchased directly in retirement accounts such as pension savings or IRPs. An ISA account can still be used. Income generated in an ISA can be separately taxed on the excess at 15.4% instead of 9.9%, making it a practical tax-saving tool for investors who are concerned about comprehensive taxation on financial income.
That said, tax treatment can differ depending on each individual’s situation. It is accurate to receive individual tax advice based on your income level and the accounts you hold.
The timing of when to buy for dividends, that is, whether it is advantageous to buy before or after the ex-dividend date, continues in the next section, 'When should you buy DIVO?'
When should you buy DIVO
DIVO dividends are paid monthly. And the key to timing is just one thing. The most recent ex-dividend date was 2026 year 5 month 28 day, and investors who held the stock before that date received a dividend of 2026 year 5 month 29 day, 0.18 dollars per share, on the following day. If you miss the ex-dividend date by one day, that month’s dividend disappears.
Let’s start by clarifying what the ex-dividend date is
The ex-dividend date is the cutoff line that means, “from this day on, it’s too late.” If you buy DIVO after this date, you will not receive that month’s dividend. You must complete your purchase by the day before the ex-dividend date.
DIVO’s dividends are paid around the end of each month’s business days, and the ex-dividend date is set approximately 7~10days earlier than the payment date. In practice, the cutoff line is a few days before the end of the month.
If you organize the date flow just once, there will be no confusion.
| Date classification | Meaning | Investor action |
|---|---|---|
| Declaration date | The day Amplify ETFs officially announces this month’s dividend amount | Check the amount |
| Ex-dividend date | Buy before this day to receive this month’s dividend | Purchase cutoff |
| Record date | The day the brokerage firm finalizes the shareholder list (the same as, or one day after, the ex-dividend date) | No separate action needed |
| Payment date | The day the dividend is actually deposited into the account | Check the deposit |
All dividend stocks follow a four-step cycle of the declaration date, ex-dividend date, record date, and payment date. Of these, the only dates investors need to pay attention to are the ex-dividend date and the payment date.
Is it cheaper to buy right after the ex-dividend date?
Many beginner investors ask this question. "If you buy the day after the ex-dividend date, isn’t it better because the stock price has already fallen?"
Half right and half wrong.
On the ex-dividend date, the stock price automatically drops by the amount of the dividend. Even if you receive the dividend, the stock price falls by the same amount, so there is no gain or loss on a net asset basis. It may look like you bought it cheaply, but in reality, nothing actually ends up in your hand.
Then what about the 'dividend capture' strategy of buying right before the ex-dividend date, receiving the dividend, and selling? In theory, if you buy before the ex-dividend date, receive the dividend, and then sell, it looks like you can pocket the dividend. But in reality, the stock price falls by the amount of the dividend, so nothing remains. If you add trading costs such as spread and slippage, you may end up taking a loss instead.
One conclusion: DIVO is not a product for short-term trading based on dividend timing. It is a structure for building monthly cash flow through long-term holding.
So when is it right to buy?
Rather than judging the right buying time by the ex-dividend date, it is better to buy by watching the stock’s price trend. However, there is one mistake to avoid.
Buying after the ex-dividend date and thinking, "I’ll get this month’s dividend." This mistake happens more often than you might think. For example,28 around the31 there are many ex-dividend dates, and if you buy after that, you have to give up that month’s dividend.
Summarized as a practical checklist, it looks like this.
- If you want to receive this month’s dividend: Check the current month’s ex-dividend date on the official Amplify ETFs website or in your brokerage app, and complete your purchase by the day before it.
- If the ex-dividend date has already passed: There is no need to rush. As long as you buy before next month’s ex-dividend date, dividends will begin that month.
- If your goal is long-term holding: The share price level is a more important variable than the ex-dividend date. Even if you buy a few days after the ex-dividend date, it will be advantageous in the long run if the share price is at a reasonable level.
How to use the dividend calendar
DIVO pays dividends every month, and the payment date is around the last business day of the month. Because the pattern is consistent, if you register it in your calendar just once, you will not miss it every month.
The specific method is as follows.
- Check the current month’s dividend announcement on the official Amplify ETFs website (amplifyetfs dot com). The declaration notice is usually posted a certain number of weeks1~2before the ex-dividend date.
- If you turn on the 'dividend alert' feature in the brokerage app you use (Kiwoom, Mirae Asset, Toss Securities, and others), you can receive alerts before the ex-dividend date.
- If you search for DIVO on free dividend-tracking sites such as stockanalysis dot com and dividendinvestor dot com, you can see the history and the next scheduled date at a glance.
As of the latest disclosure, the dividends are as follows.
| Month | Dividend (per share) | |---| | 2026year 3month | 0.1787dollars | | 2026year 4month | 0.1812dollars | | 2026year 5month | 0.1842dollars |
Because the amount changes slightly every month, it is necessary to get into the habit of checking it right after each disclosure.
When buying DIVO alone, a few shares each month, how much cash actually ends up in hand, and how the cash flow changes when combined with SCHD and JEPI, are calculated directly by investment size in the next section <strong>'Practical portfolio: where should DIVO be mixed in?'</strong>.
Practical portfolio: where should DIVO be mixed in?
DIVO's dividend yield is at an annual 4.85%, and JEPI's recent 12-month dividend yield is about 9.26%.
SCHD has assets under management of about 910billion dollars and a dividend yield of about 3.3%.
The three ETFs may seem to have different return figures, but depending on the mix ratio, you can design both a structure that pays a lot right away and a structure in which dividends grow larger 10years later.
What kind of investors are the three ETFs suited for, and how?
Before building a combination, you need to sort out the role of each ETF.
JEPI combines S&P 500constituents and a covered-call strategy, so the dividend is large. Because the income structure centers on option premiums, asset growth tends to be limited. It is suited to investors who want a large monthly dividend and need cash right away.
SCHD focuses on proven dividend stocks and pays dividends. Dividends tend to grow steadily every year. Over the past 10 years, dividends grew at an annual rate of 10 to 12%, and investors who bought 10 years ago are now receiving dividends of more than 7% of their principal.
DIVO blends dividend stocks and covered calls to stand at a middle point, offering a return of about 4.85% and relatively moderate volatility. In rising markets, it tracks 75 to 85% of the stock’s gains, so growth is not completely capped the way it is with JEPI.
Target allocation ratios: how to mix them
If the investment objective differs, the ratio should also differ. It is divided into the three scenarios below.
| Investment goal | DIVO | JEPI | SCHD | Expected average return |
|---|---|---|---|---|
| Cash right away is the top priority | 30% | 50% | 20% | about 6.5% |
| Balance between cash and growth | 40% | 30% | 30% | about 5.5% |
| Long-term growth focus | 20% | 10% | 70% | about 4.0% |
The expected return is a simple weighted average based on each ETF’s most recent dividend yield, before tax and without reflecting exchange-rate fluctuations.
The cash-first approach is suited to investors who must cover monthly living expenses after retirement with dividends. It increases the amount received now by raising the JEPI allocation, while preserving a minimum growth base with SCHD.
The balanced approach is the most natural way to use DIVO. DIVO’s yield and participation in rising markets, JEPI’s cash supplementation, and SCHD’s dividend growth each divide up their roles.
The growth-focused approach is suitable for investors who have not yet used dividends and 10or more years. If the SCHD allocation is raised to 70 percent, the dividends received immediately will decrease, but over time the dividends are likely to grow.
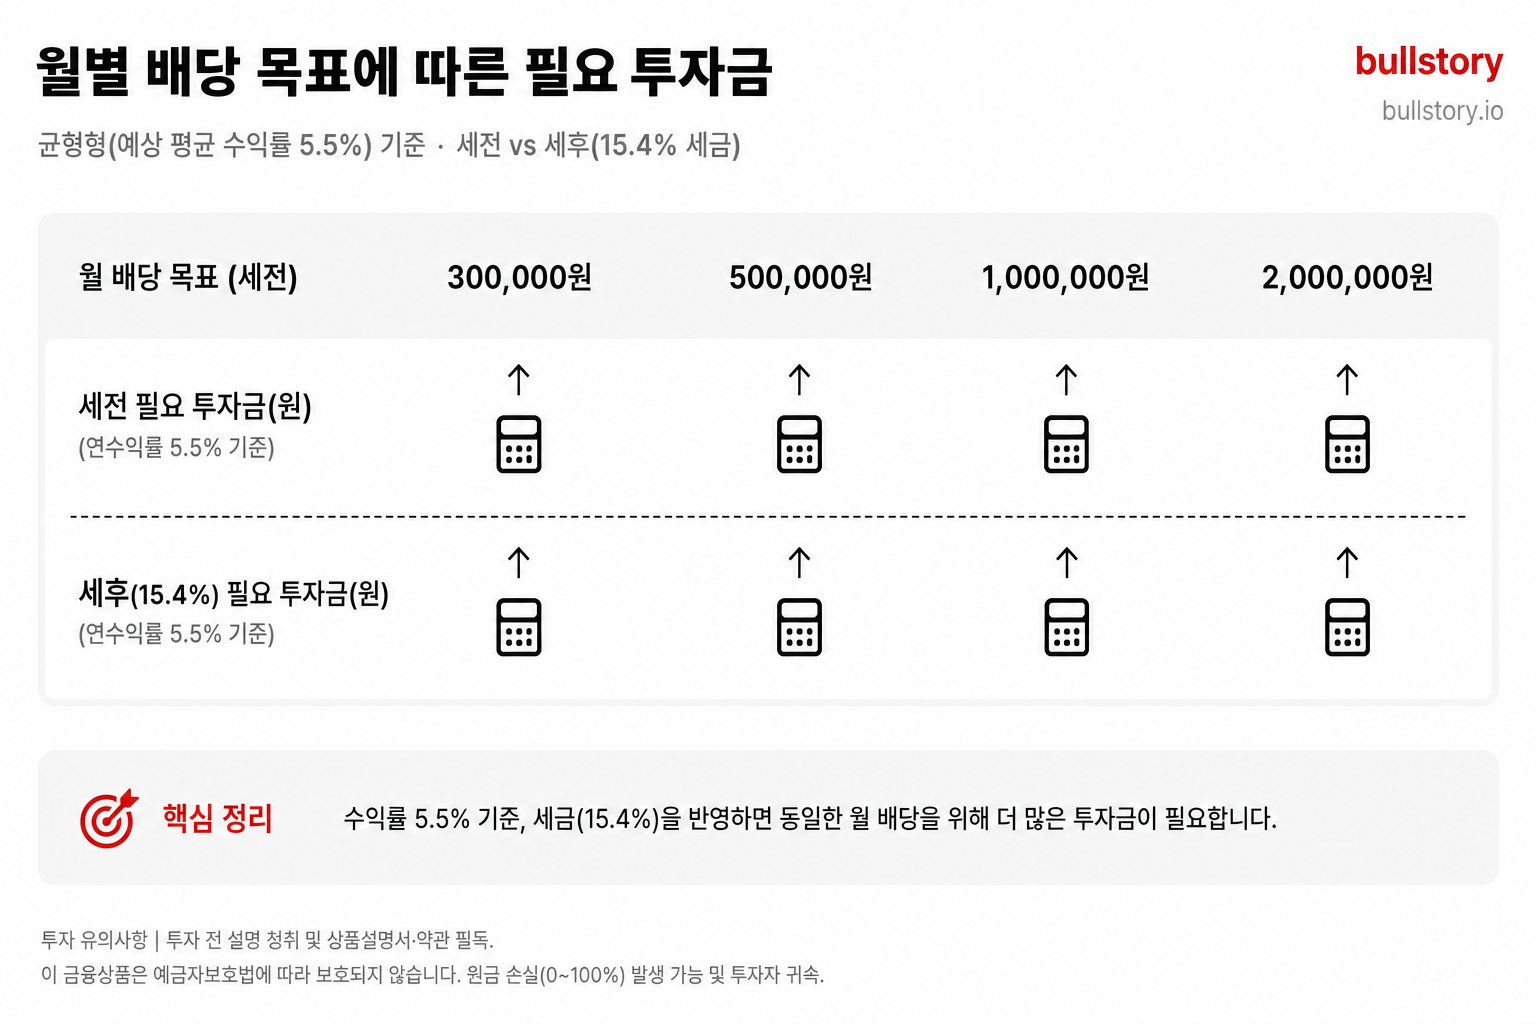
Required investment by monthly cash-flow target
Using the balanced approach (the middle combination in the table) and applying an average dividend yield of about 5.5 percent, the table below is as follows.
| Monthly target dividend | Pre-tax required investment | After-tax basis (15.4% dividend income tax applied) |
|---|---|---|
| Monthly 30 ten-thousand won (about 220 dollars) | about 6,500 ten-thousand won | about 7,700 ten-thousand won |
| Monthly 50 ten-thousand won (about 370 dollars) | about 1 hundred-million 900 ten-thousand won | about 1 hundred-million 2,900 ten-thousand won |
| Monthly 100 ten-thousand won (about 730 dollars) | about 2 hundred-million 1,800 ten-thousand won | about 2 hundred-million 5,800 ten-thousand won |
| Monthly 200 ten-thousand won (about 1,460 dollars) | about 4 hundred-million 3,600 ten-thousand won | about 5 hundred-million 1,600 ten-thousand won |
The after-tax calculation is based on a combined 15% of U.S. dividend withholding tax and 0.4% of local income tax, for a total of 15.4%. Whether annual financial income exceeds the threshold for comprehensive taxation of financial income affects the actual tax burden. Check your individual situation with a tax accountant.2,000. The actual tax burden varies depending on whether annual financial income exceeds the threshold of
On an after-tax basis, to receive monthly 100 ten-thousand won entirely from dividends, you need about 2 hundred-million 5,800 ten-thousand won. That is larger than expected. So from the start, a strategy of reinvesting dividend income to grow principal is important.
Practical cautions when using DIVO as the core
DIVO's assets under management are about 71 hundred-million 8,000 ten-thousand dollars. The expense ratio is 0.56%.
For example, 10if you invest ten thousand dollars, 1in a year 560dollars will be taken out as expenses. Compared with SCHD’s expense ratio of 0.06%, it is more than 9times as expensive. This difference may seem negligible at first, but over 20years it compounds significantly.
The nature of the dividends also needs to be considered. The option premium income mixed into DIVO may sometimes be taxed as short-term capital gains or dividend income, so its tax treatment can differ from that of pure dividend stocks. For details, see the section 'Where do dividends come from'.
Over the most recent 1 years, DIVO’s total return was about 18%.
SCHD was about 26%, and JEPI was about 8%. JEPI is the lowest. Even if the dividend yield is high, if stock-price growth stalls, total returns are low. If you build a portfolio looking only at cash flow, you can fall into this trap.
The conclusion is clear. DIVO acts as a 'middle bridge' that supplements the low yield of the core dividend stock ETF (SCHD) and partially eases JEPI’s limited upside participation. Rather than using the three ETFs on their own, setting the allocation to match your goal and rebalancing (periodically restoring the portfolio to its original proportions) is the way to protect both cash flow and asset growth over the long term.
Glossary
I have briefly organized only the key terms that appear in this article. I selected only those directly connected to DIVO’s dividend structure and investment judgment.
-
Covered Call: A strategy that sells the market the right to sell held shares at "this price" and receives a premium (option fee). In exchange for giving up part of the upside when the stock price rises, it takes cash upfront. DIVO differs from JEPI and similar funds in that it uses this strategy selectively on only some holdings, rather than across the entire portfolio.
-
Ex-Dividend Date: If you buy the stock after this date, you will not receive that year's dividend. To receive the dividend, you must hold it through the day before the ex-dividend date. The practical use is explained in the "When should you buy DIVO?" section.
-
Dividend Yield: The annual dividend amount relative to the current stock price. For example, 100when investing ten thousand won, 1it shows how many ten thousand won units you would receive in dividends in one year. For DIVO's dividend yield figure, see the "How much does it pay now" section.
-
MDD (Maximum Drawdown): The maximum decline ratio from peak to trough during a specific period. It shows "how much loss you could face in the worst case if you hold this ETF." The lower the MDD, the easier it is to hold through a downturn.
-
Active ETF: An ETF in which the fund manager directly selects holdings and adjusts weights. It has a higher management fee than passive ETFs that simply follow rules, such as S&P 500. DIVO is an active ETF, and its management fee is 0.55%.
-
Option Premium: the consideration received for selling the right in a covered call strategy. It is cash that comes in definitively regardless of stock price fluctuations, so it becomes part of the source for monthly dividends. However, this part may be treated differently from dividend income in tax processing (see the main text for details).
-
Comprehensive Taxation of Financial Income: if financial income such as interest and dividends exceeds 2,000won in a year, it is a system in which it is taxed together with other income at the top tax rate (45%).
-
Separation taxation of financial income: up to is subject to separate taxation per year. In this case, the tax rate is %.2,000- Detailed composition of separate taxation: the separate taxation rate of % is made up of income tax % and local income tax %.15.4- Dividend income tax: the tax imposed on overseas ETF dividends. In the United States, % is withheld at source first, and in South Korea, it is finally adjusted so that the effective tax rate becomes %.
-
Detailed composition of separate taxation: the separate taxation rate of % is made up of income tax % and local income tax %.15.4- Dividend income tax: the tax imposed on overseas ETF dividends. In the United States, % is withheld at source first, and in South Korea, it is finally adjusted so that the effective tax rate becomes %.14- Total Return: the actual return that combines both stock price gains and dividends. Looking only at dividend yield can cause you to miss the overall performance.1.4The comparison of the total return of DIVO, JEPI, and SCHD is organized in a table with items in the 'DIVO vs JEPI vs SCHD, direct comparison by the numbers' section.
-
Dividend income tax: the tax imposed on overseas ETF dividends. In the United States, % is withheld at source first, and in South Korea, it is finally adjusted so that the effective tax rate becomes %.15- Total Return: the actual return that combines both stock price gains and dividends. Looking only at dividend yield can cause you to miss the overall performance.15.4The comparison of the total return of DIVO, JEPI, and SCHD is organized in a table with items in the 'DIVO vs JEPI vs SCHD, direct comparison by the numbers' section.
-
Total Return: the actual return that combines both stock price gains and dividends. Looking only at dividend yield can cause you to miss the overall performance. The comparison of the total return of DIVO, JEPI, and SCHD is organized in a table with items in the 'DIVO vs JEPI vs SCHD, direct comparison by the numbers' section.5items are organized in a table.
Frequently asked questions
What is DIVO’s current dividend yield?
2026As of year 6month 29day, it is annual 4.85percent. The sum of dividends per share over the last 12months is 2.21dollars.
What was DIVO’s monthly dividend per share recently?
2026As of 5the month of 28the recent monthly dividend was 0.184dollars per share. 3Both the 4and the month also showed a slight upward trend.
What is DIVO’s dividend growth rate?
Recently, 1the one-year growth rate was 9.96%, and the 5-year average was 4.50%, so the recent 1year growth pace is faster.
Why does DIVO pay dividends every month?
20to 25blue-chip stocks’ regular dividends and the option premiums earned from covered calls on held stocks to create monthly cash flow.
When is DIVO's next ex-dividend date expected to be?
The next ex-dividend date is expected to be 8month 21day~9month 1day, so please check Amplify's official disclosure directly.
What is the difference between DIVO and JEPI?
The biggest difference is size and strategy. DIVO has assets under management of about 71hundred million dollars, while JEPI is in the tens of billions of dollars, and DIVO selectively writes covered calls only on some holdings.